.png)
U.S. inflation figures surprised on the upside once again and were the main reason for the volatility seen in the markets last week. On Wednesday, we learned that U.S. prices rose by 9.1% year-over-year in June, a higher-than-expected figure and the highest level since November 1981. The data sent the markets lower, with the S&P 500 Index hitting its lowest level since June 22 during Thursday's session. However, U.S. stocks rallied on Friday following quarterly results from some major banks, but also thanks to the release of a survey by the University of Michigan showing that long-term inflation expectations fell in June to 2.8% from 3.1% previously. This measure is now at its lowest level in a year and down sharply from the high of +3.3% reached in Q2. While the major equity indices ended in the red by the end of the week, this data likely prevented a larger decline.
Chart #1 - The chart that saved the week
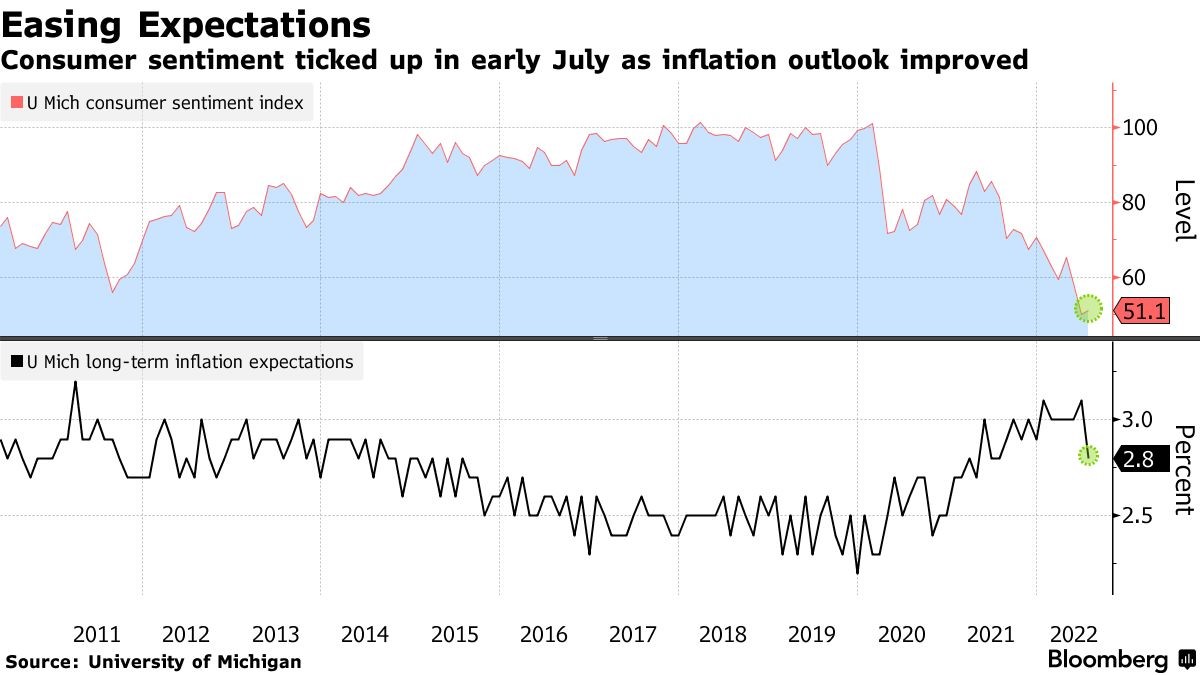
Chart #2 - More rate hikes anticipated this year but also more rate cuts expected next year…
The likelihood of a 100 basis point hike by the Fed in July has increased over the week, but remains below the levels reached following the release of the inflation numbers on Wednesday. As explained in the previous point, the University of Michigan survey seems to have somewhat reassured investors on the future trajectory of inflation and interest rates. Thus, while forecasts for rate hikes in 2022 are up, so are forecasts for rate cuts in 2023... CME Group's Fedwatch tool shows that futures contracts are now forecasting rate cuts as early as February 2023.
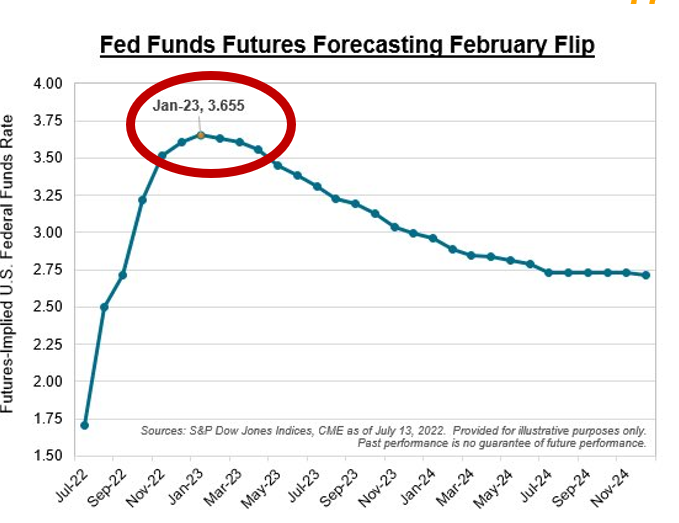
Chart #3 - US equities: a change in leadership?
U.S. 10-year bond yields ended the week below 3.00%. The U.S. bond yield curve in the 2-year to 10-year segment is now at its most inverted level since 2000. The outperformance of the long end of the curve and the decline in commodity prices appears to have created a leadership shift in "style" factors in the US market. As the chart below shows, the style indices that were the worst performers since the beginning of the year (e.g. growth style, which includes technology stocks) have been the best performers in July. The opposite is also true, since the value style (which includes oil stocks) is clearly lagging in July, while it was by far the best performer throughout the first half of the year.
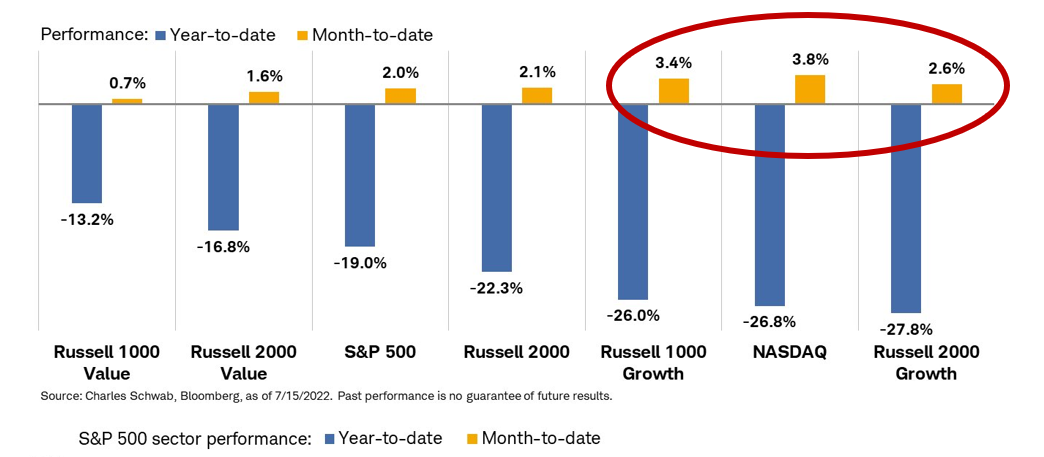
Chart #4 - Commodities down for the 4th week in a row
This past week, the Bloomberg Commodity Index returned to its pre-Russian invasion of Ukraine levels. Continued weakness in industrial metals has helped push the index's performance down to -7% month-to-date. Industrial metals are down 37% from their peak earlier this year. The main reason for the sharp correction in commodities is that markets are anticipating that monetary tightening by many countries will have a negative impact on demand and therefore prices.
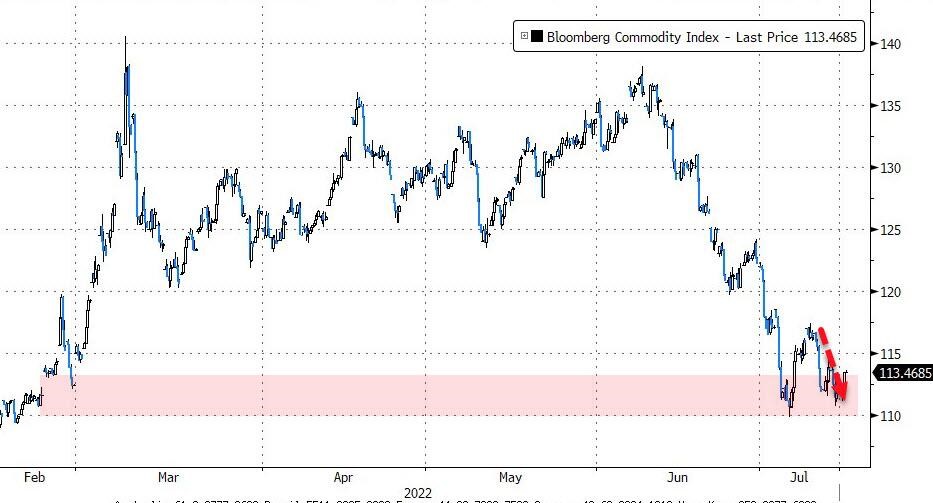
Chart #5 - Italy vs. Germany bond yield spreads continue to widen following a new political crisis in Italy
Italian Prime Minister Mario Draghi has tendered his resignation after one of the coalition parties - the populist Five Star movement - withdrew its support for the government in a parliamentary vote of confidence. However, the president has (for now) refused to accept his resignation.
As a result of this new political crisis, Italian 10-year bond yields continue to diverge relative to German Bund yields. Are the markets incorporating a heightened probability of an "Italexit"? The fact that Italian bond yields remain relatively well correlated with the rest of the Eurozone suggests that, for the time being, the market is assigning a very low probability to this systemic risk.
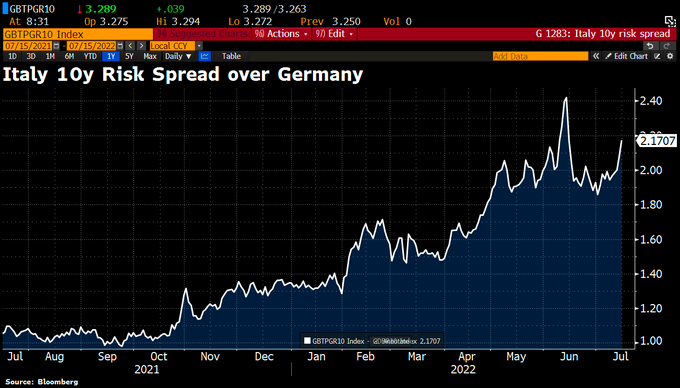
Chart #6 - What will the European Central Bank do?
The euro reached parity with the dollar last week. This is its lowest level since 2002. While the current energy crisis facing the EU is one of the main catalysts for the euro's fall, it is probably not the only factor at play. Indeed, the ECB is very late in its monetary policy adjustment, which most certainly explains part of the euro's weakness. Could the rise in short-term rates compensate for some of the currency's weakness? In Switzerland, the SNB's rate hike has allowed the franc to strengthen. However, the situation is more complex in Europe as some countries (e.g. Germany) could already be in recession. The answer should come this week with the much awaited ECB meeting on Thursday.
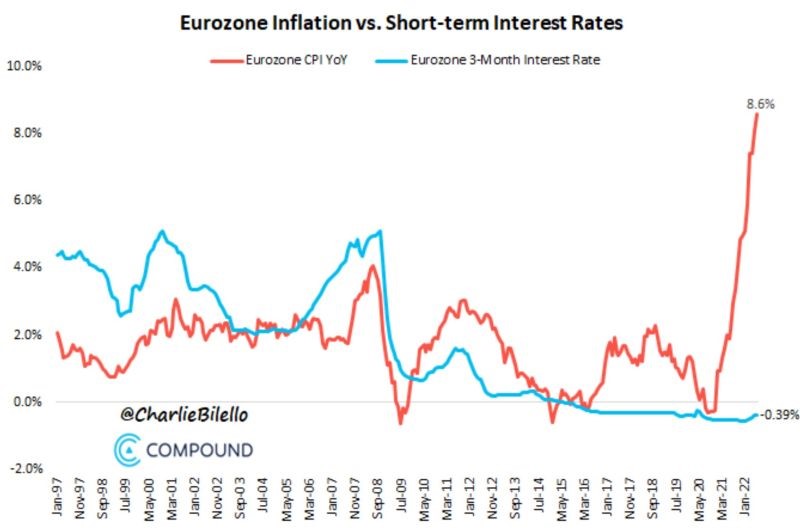
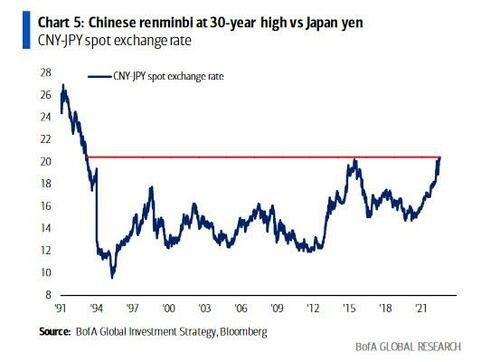
Chart #7 - Is China likely to devalue its currency and step up its stimulus measures?
The Chinese renminbi is currently at a 30-year high against the Japanese yen. With China's only source of growth in 2022 expected to be exports, and with Japan as one of its main competitors, Beijing is facing increasing pressure to devalue the renminbi.
With property developers in serious trouble and Chinese bank stocks continuing to fall to two-year lows (amid fears that widespread mortgage defaults could cause contagion within the banking sector), there is also strong pressure on the Chinese authorities to provide additional monetary and fiscal support.