Charles-Henry Monchau, CFA, CMT, CAIA

Chief Investment Officer

Chart #1 — 

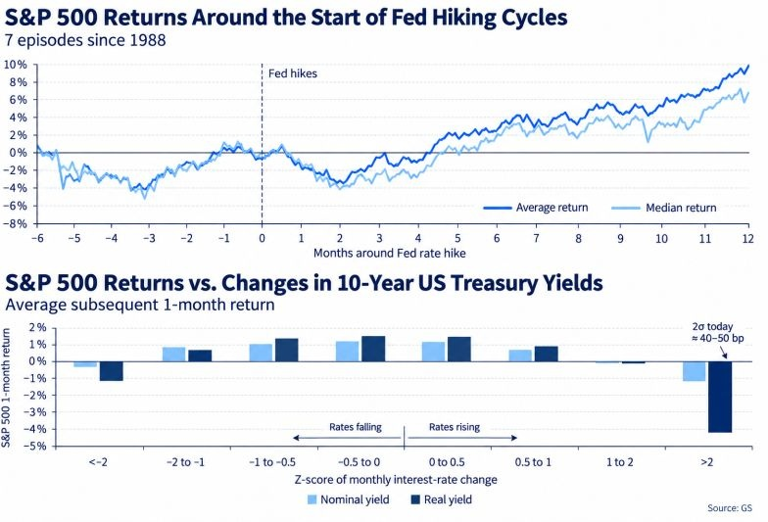
S&P 500 returns around the start of Fed hiking cycles

Drawing on the last seven tightening cycles, Goldman Sachs observes that the S&P 500 typically has a difficult start, losing an average of 2% over the first three months.

This slump rarely lasts long. The index then rises by an average of 9% over the following twelve months. 2022 was the painful exception. Earnings growth ultimately sets the market’s direction, but the speed and volatility of the move in rates can weigh heavily on equities along the way.

Source: Goldman Sachs


Chart #2 — 

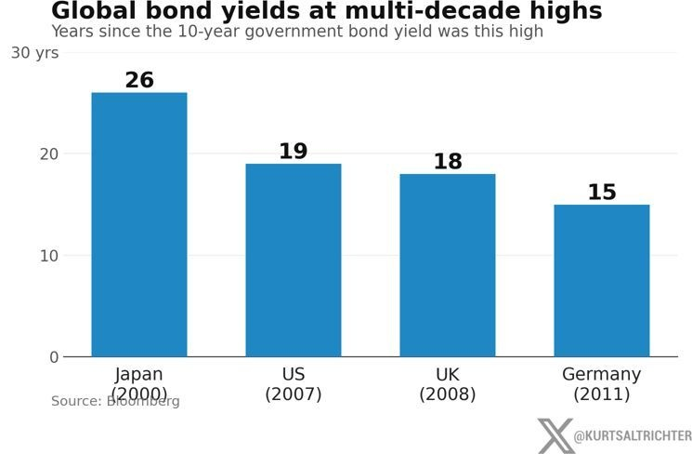
Global bond yields at multi-decade highs

Every major government bond market is under pressure at the same time. Japan’s 10-year yield has just reached 3% for the first time this century, while US yields stand at their highest since 2007, UK yields since 2008, and German yields since 2011.

Source: Bloomberg, Kurtsalrichter


Chart #3 — 

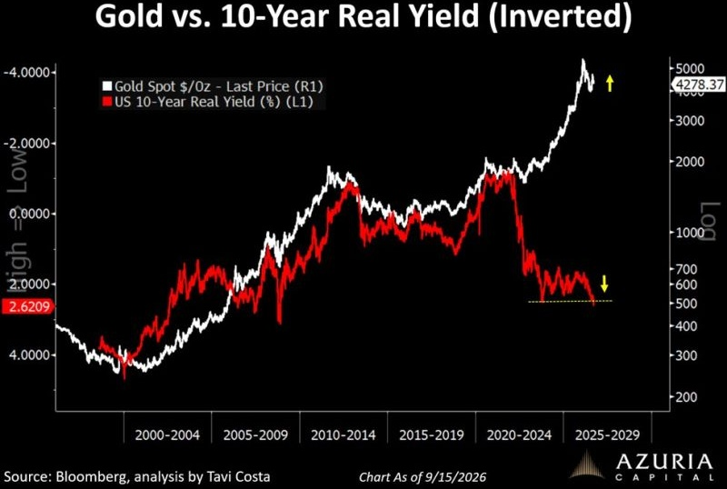
The historic relationship between gold and US real yields has broken down

This is one of the most striking macroeconomic divergences in today’s markets. Gold’s long-standing link to US real yields has come apart. Since Western governments froze Russia’s reserves, central banks have increasingly treated gold as politically neutral reserve collateral. Real yields, meanwhile, are moving towards levels the US fiscal position can barely absorb. At this level of debt, real rates that stay higher for longer are more than merely restrictive, they represent a growing solvency risk.

This divergence is reflected in current market levels, with gold trading near $4,400 while 10-year real yields stand at around 2.5%.

Source: Tavi Costa


Chart #4 — 

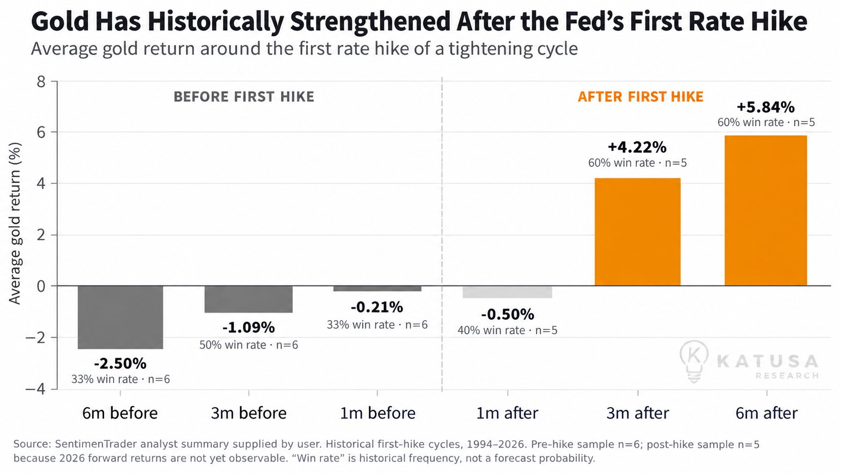
Gold rate hikes have some good historical news for investors

Historically, gold has tended to strengthen after the Fed’s first rate hike, with the strongest gains occurring in the following six months.

Source: Katusa Research, @sentimentrader


Chart #5 — 

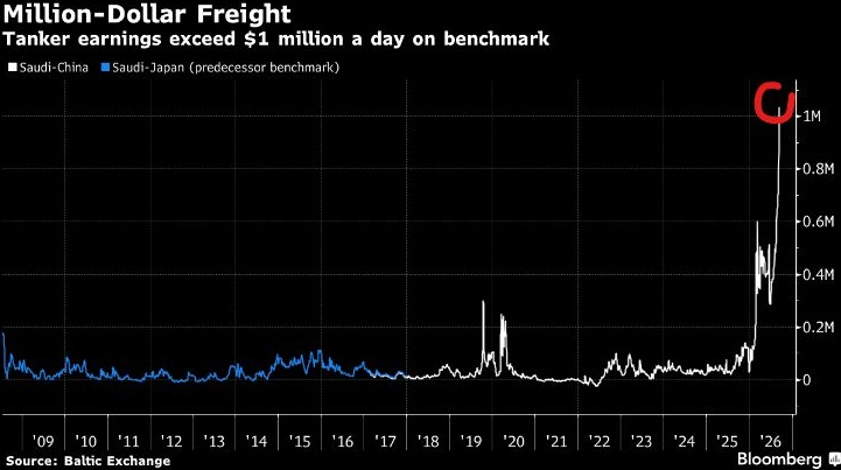
Tanker earnings exceed $1 million a day on benchmark 


For the first time, the cost of chartering an oil tanker on the industry’s benchmark route from the Middle East to the Far East has passed $1 million a day. A year ago, the same voyage earned less than $100,000 a day.

Source: Javier Blas, Bloomberg


Chart #6 —

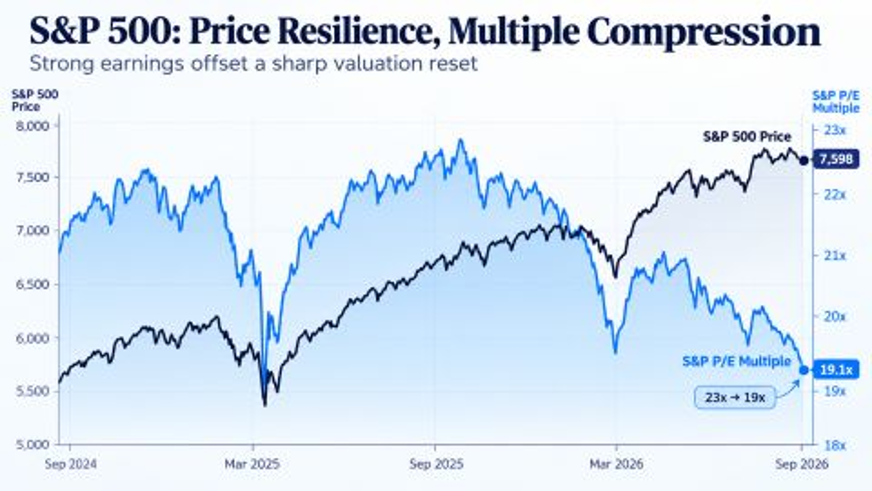
S&P 500 price vs. valuation

What explains the resilience of the S&P 500? Exceptionally strong earnings growth.

Geopolitical shocks and persistent uncertainty, which have pushed oil prices and bond yields higher, have nonetheless triggered a valuation reset of the kind normally seen in a bear market. The index’s P/E multiple has compressed from 23x at the end of 2024 to roughly 19x today. The headline index looks resilient, yet beneath the surface uncertainty is already being priced in through lower valuations.

Source: Bastien Chenivesse, Bloomberg


Chart #7 — 

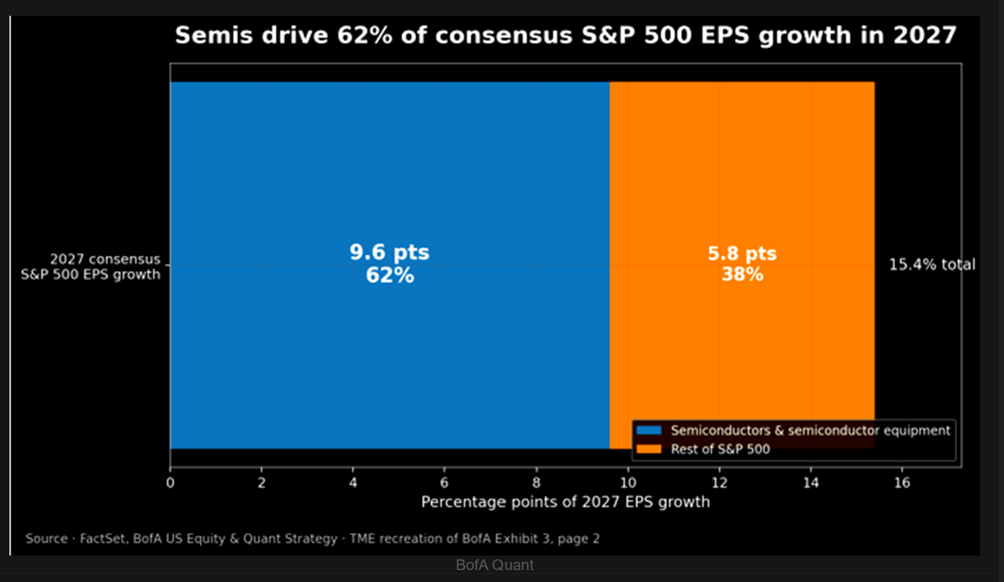
62% of the entire S&P 500 index’s expected EPS growth comes from one industry

The five largest companies now represent a record 27% of expected S&P 500 earnings over the next 12 months. More striking still, semiconductors and semiconductor equipment are forecast to deliver 9.6 percentage points of the 15.4% consensus EPS growth expected for the S&P 500 in 2027. In other words, a single industry accounts for 62% of the index’s entire expected EPS growth.

None of this implies that the semiconductor forecasts are wrong. It does mean the margin for error is narrowing: the companies carrying earnings growth have to keep delivering, while elevated inflation prevents the discount rate from offering any relief.

BofA also expects Hyperscalers capex growth to decelerate from more than 90% in 2026 to around 35% in 2027. That is still a very high rate, but the acceleration phase is fading just as the index becomes unusually dependent on semiconductor earnings.

Source: TME, BofA


Disclaimer

This marketing document has been issued by Bank Syz Ltd. It is not intended for distribution to, publication, provision or use by individuals or legal entities that are citizens of or reside in a state, country or jurisdiction in which applicable laws and regulations prohibit its distribution, publication, provision or use. It is not directed to any person or entity to whom it would be illegal to send such marketing material. This document is intended for informational purposes only and should not be construed as an offer, solicitation or recommendation for the subscription, purchase, sale or safekeeping of any security or financial instrument or for the engagement in any other transaction, as the provision of any investment advice or service, or as a contractual document. Nothing in this document constitutes an investment, legal, tax or accounting advice or a representation that any investment or strategy is suitable or appropriate for an investor's particular and individual circumstances, nor does it constitute a personalized investment advice for any investor. This document reflects the information, opinions and comments of Bank Syz Ltd. as of the date of its publication, which are subject to change without notice. The opinions and comments of the authors in this document reflect their current views and may not coincide with those of other Syz Group entities or third parties, which may have reached different conclusions. The market valuations, terms and calculations contained herein are estimates only. The information provided comes from sources deemed reliable, but Bank Syz Ltd. does not guarantee its completeness, accuracy, reliability and actuality. Past performance gives no indication of nor guarantees current or future results. Bank Syz Ltd. accepts no liability for any loss arising from the use of this document.

Read More

Straight from the Desk

Syz the moment

Live feeds, charts, breaking stories, all day long.

Thinking out loud

Sign up for our weekly email highlighting the most popular posts.

Follow us

Thinking out loud

Investing with intelligence

Our latest research, commentary and market outlooks