Charles-Henry Monchau

Chief Investment Officer

Chart #1 — 

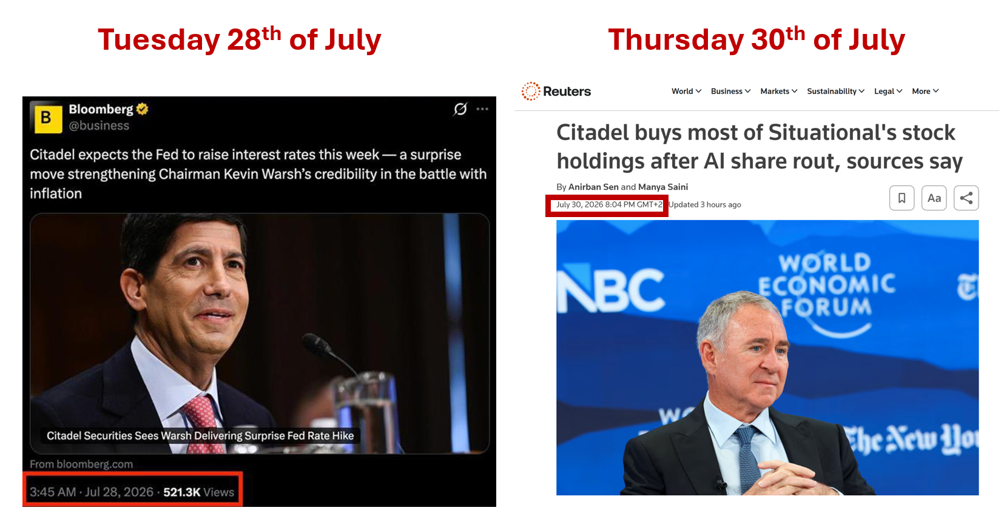
The best-performing fund of 2026 just got wiped out by its own leverage

Leopold Aschenbrenner’s Situational Awareness fund went from a top-performing AI-focused hedge fund to one of the fastest collapses in recent market history. After gaining 439% in 2026 and growing from $225mn to a reported $45bn portfolio, the fund’s concentrated bets on AI hardware stocks and software shorts were amplified by leverage of roughly four times its capital, boosting returns during the rally but magnifying losses when the trade reversed and Adobe moved higher. Margin calls forced a rapid liquidation, with Citadel acquiring much of the book. The episode highlights the risks of excessive leverage in crowded AI trades.

Source: Bloomberg/Reuters


Chart #2 — 

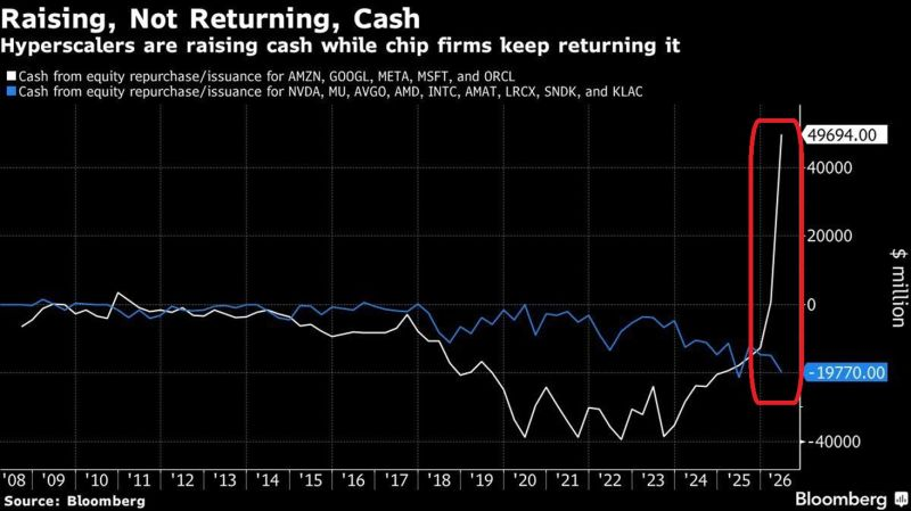
US Big Tech has flipped from returning massive cash to shareholders to demanding capital from investors

For years, Big Tech's biggest names drove shareholder returns through aggressive buybacks. In 2023, Amazon, Alphabet, Meta, Microsoft, and Oracle collectively repurchased up to $40bn of their own stock. That's now reversed: the same group has shifted to raising capital, hitting a record $49.7bn in net issuance.

Semiconductor firms like Nvidia, AMD, and Intel remain on the other side, still returning roughly $19.8bn via buybacks. Since the dot-com crash, investors saw Big Tech as a reliable cash machine. This shift raises a new question: if AI spending doesn't translate into earnings growth, will investors start demanding higher returns, and pressure valuations?

Source: Bloomberg, Global Markets Investor


Chart #3 — 

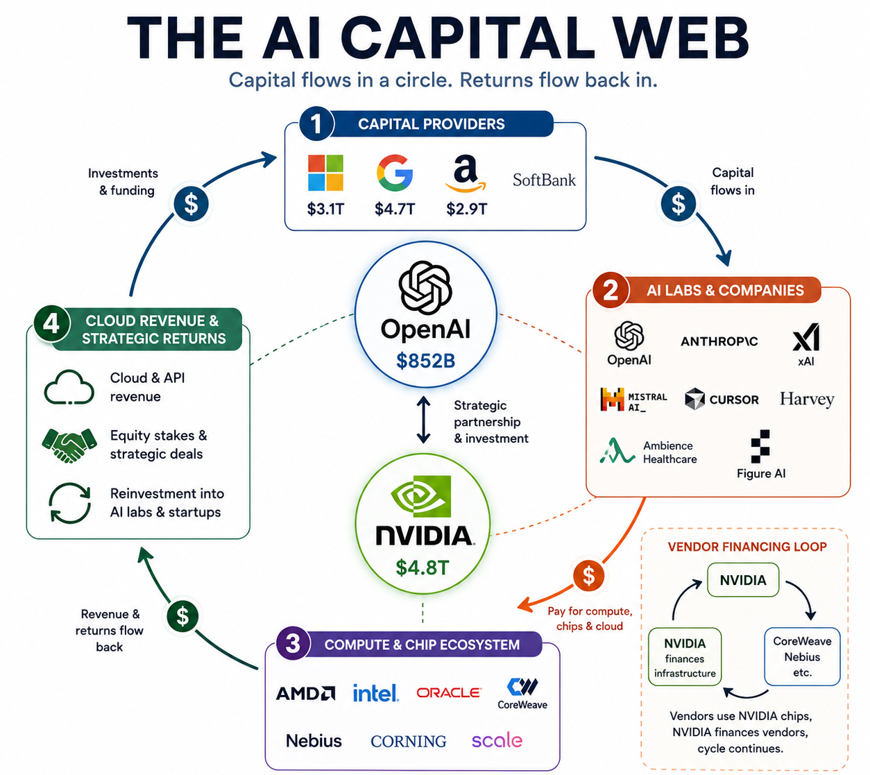
The AI circular economy 

Nvidia is currently involved in more than $750bn worth of AI-related agreements, but the structure of some of these deals has raised questions among investors. Bloomberg highlighted several large-scale arrangements, including a reported $500bn partnership with SK Group in South Korea. Another major example involves OpenAI, where Nvidia is reportedly providing financial support while also committing to purchase large quantities of its own AI chips.

The common pattern is that Nvidia provides capital or financial backing to AI companies, in turn buy Nvidia’s hardware. This creates a financial ecosystem where money flows between companies within the same AI infrastructure chain.

Nvidia CEO Jensen Huang has rejected the idea that this represents a circular structure, calling the criticism “ridiculous.” 

Source: Hedgie


Chart #4 — 

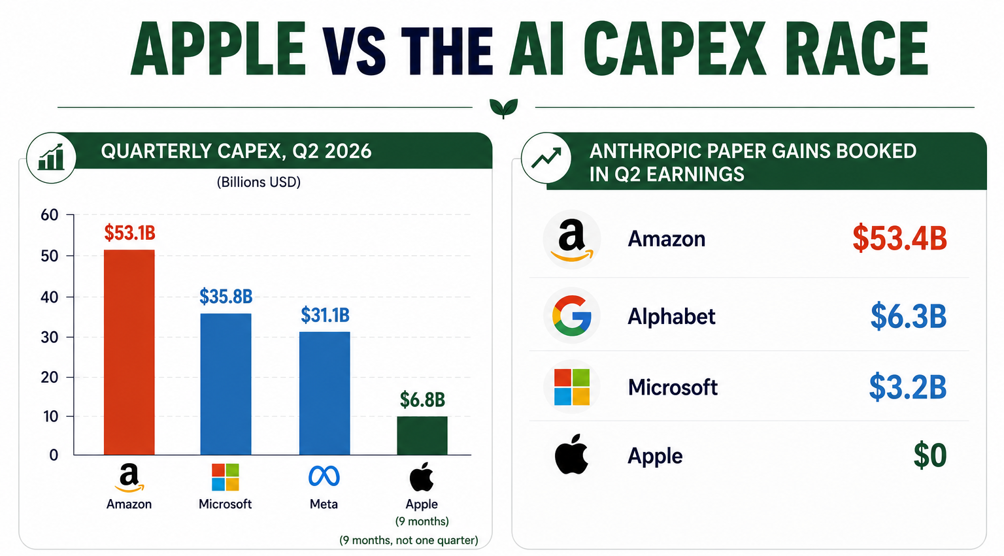
Apple just reminded investors that AI isn't the only path to strong earnings

Apple delivered another strong quarter, generating $109.4bn in revenue, representing 16% growth year over year. iPhone revenue increased 22%, Services reached a record $30.7bn, and net income climbed 27% to $29.8bn.


Unlike several major technology companies that benefited from investment gains or AI-related optimism, Apple’s results were driven primarily by the strength of its core business.

The company maintained a disciplined capital approach, spending only $6.8bn on capital expenditures during the first nine months of the fiscal year, while returning $62bn to shareholders through buybacks. Apple also continued reducing debt and ended the quarter with $146bn in cash and marketable securities.

Despite the strong results, shares declined after hours following weaker-than-expected fourth-quarter guidance linked to supply constraints.

Source: Hedgie


Chart #5 — 

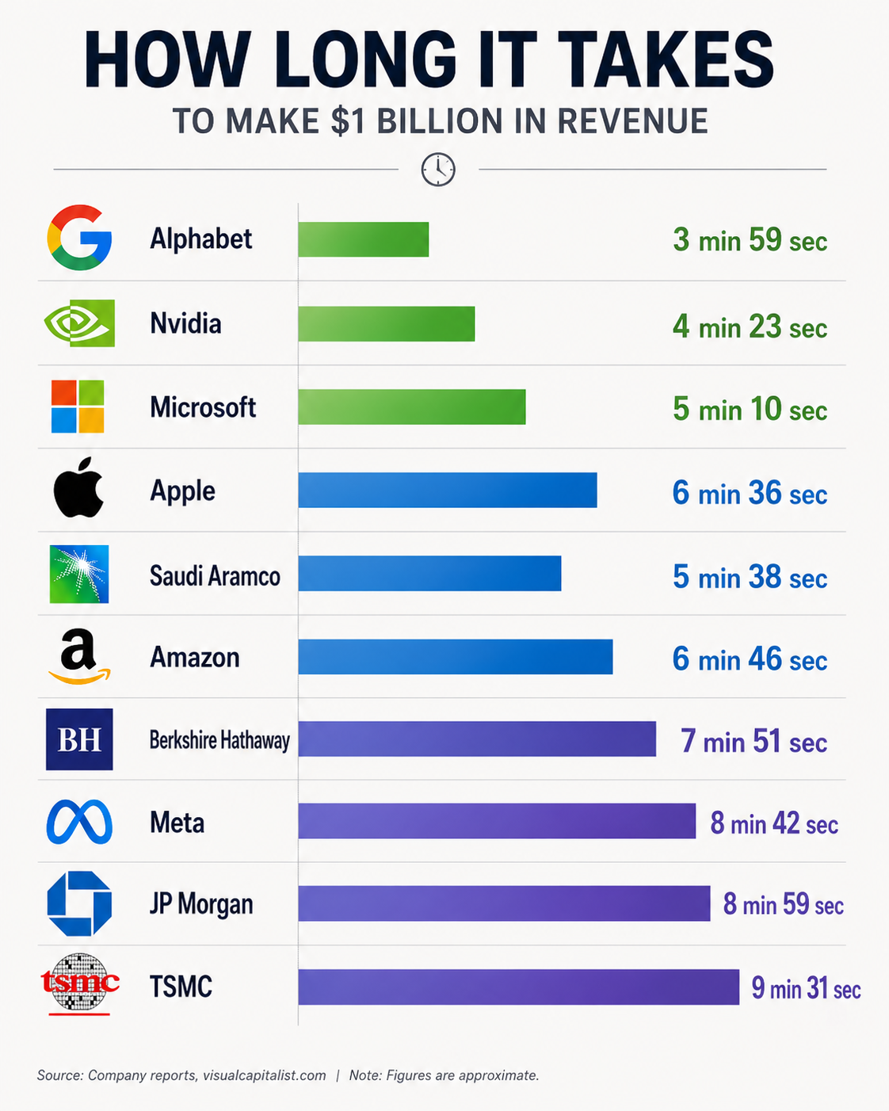
How fast do they generate 1mn in profit?


Alphabet generates one million dollars in profit in less than four minutes. The figure highlights the extraordinary earnings power of the world’s largest technology companies and the scale of profitability behind the AI ecosystem.


Source: Lukas Ekwueme, FT 


Chart #6 —

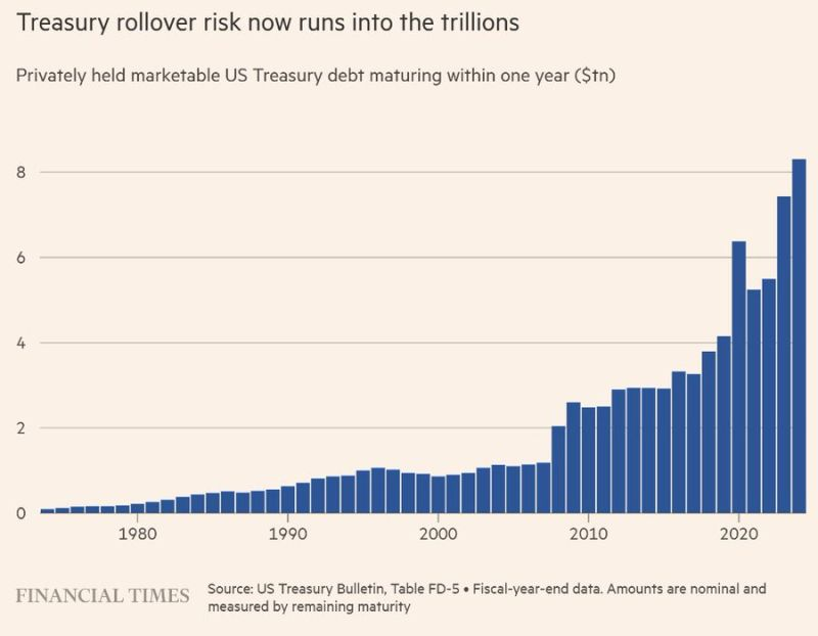
Why the US has little room for much higher rates

The United States faces a major refinancing challenge, with approximately $8tn of Treasury debt expected to mature over the next 12 months.

The average interest rate on this debt is around 3.3%, while the 2-year Treasury yield is currently close to 4.3%. Refinancing the entire amount at today’s rates would increase annual interest expenses by roughly $80bn, even before considering the government’s ongoing $2tn annual budget deficit.

Today's situation differs from the early 1980s. Volcker-era inflation had already eroded the real burden of government debt, giving policymakers room to hike rates aggressively, and debt-to-GDP fell from ~120% post-WWII to ~30%. Now debt is back near 120%, with no such cushion.


Source: Financial Times


Chart #7 — 

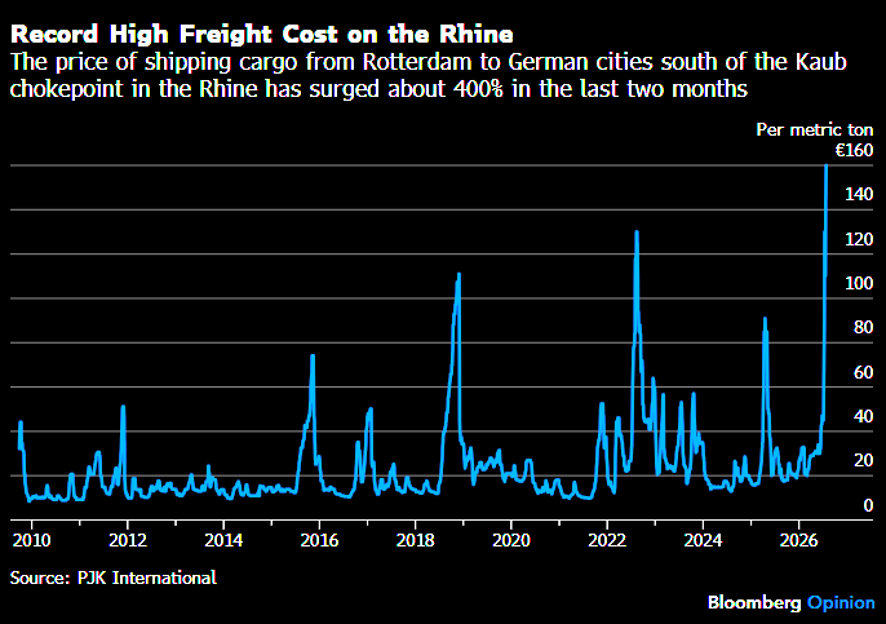
Record freight cost on the Rhine

The Rhine River, one of Europe’s most important transport routes for refined petroleum products, chemicals, coal, and steel, is facing major disruptions due to unusually low water levels. Reduced shipping capacity has pushed freight prices for Rhine barges to record highs, increasing transportation costs across several industrial sectors.

Source: Bloomberg, Javier Blas


Disclaimer

This marketing document has been issued by Bank Syz Ltd. It is not intended for distribution to, publication, provision or use by individuals or legal entities that are citizens of or reside in a state, country or jurisdiction in which applicable laws and regulations prohibit its distribution, publication, provision or use. It is not directed to any person or entity to whom it would be illegal to send such marketing material. This document is intended for informational purposes only and should not be construed as an offer, solicitation or recommendation for the subscription, purchase, sale or safekeeping of any security or financial instrument or for the engagement in any other transaction, as the provision of any investment advice or service, or as a contractual document. Nothing in this document constitutes an investment, legal, tax or accounting advice or a representation that any investment or strategy is suitable or appropriate for an investor's particular and individual circumstances, nor does it constitute a personalized investment advice for any investor. This document reflects the information, opinions and comments of Bank Syz Ltd. as of the date of its publication, which are subject to change without notice. The opinions and comments of the authors in this document reflect their current views and may not coincide with those of other Syz Group entities or third parties, which may have reached different conclusions. The market valuations, terms and calculations contained herein are estimates only. The information provided comes from sources deemed reliable, but Bank Syz Ltd. does not guarantee its completeness, accuracy, reliability and actuality. Past performance gives no indication of nor guarantees current or future results. Bank Syz Ltd. accepts no liability for any loss arising from the use of this document.

Read More

Straight from the Desk

Syz the moment

Live feeds, charts, breaking stories, all day long.

Thinking out loud

Sign up for our weekly email highlighting the most popular posts.

Follow us

Thinking out loud

Investing with intelligence

Our latest research, commentary and market outlooks