
.png)
Contributions to US Q3 GDP growth
Source: FactSet, Edward Jones
We are sorry that for legal reasons we are not able to help US citizens or Canadian residents other than in Ontario, Quebec, or Alberta. Best wishes for the future…
We are sorry that for legal reasons we are not able to help US citizens or Canadian residents other than in Ontario, Quebec, or Alberta. Best wishes for the future…
You chose the following profile. If you made a mistake, please change here USA
This marketing document has been issued by Bank Syz Ltd. It is not intended for distribution to, publication, provision or use by individuals or legal entities that are citizens of or reside in a state, country or jurisdiction in which applicable laws and regulations prohibit its distribution, publication, provision or use. It is not directed to any person or entity to whom it would be illegal to send such marketing material.
This document is intended for informational purposes only and should not be construed as an offer, solicitation or recommendation for the subscription, purchase, sale or safekeeping of any security or financial instrument or for the engagement in any other transaction, as the provision of any investment advice or service, or as a contractual document. Nothing in this document constitutes an investment, legal, tax or accounting advice or a representation that any investment or strategy is suitable or appropriate for an investor's particular and individual circumstances, nor does it constitute a personalized investment advice for any investor.
This document reflects the information, opinions and comments of Bank Syz Ltd. as of the date of its publication, which are subject to change without notice. The opinions and comments of the authors in this document reflect their current views and may not coincide with those of other
Syz Group entities or third parties, which may have reached different conclusions. The market valuations, terms and calculations contained herein are estimates only. The information provided comes from sources deemed reliable, but Bank Syz Ltd. does not guarantee its completeness, accuracy, reliability and actuality. Past performance gives no indication of nor guarantees current or future results. Bank Syz Ltd. accepts no liability for any loss arising from the use of this document.

Charles-Henry Monchau
Chief Investment Officer
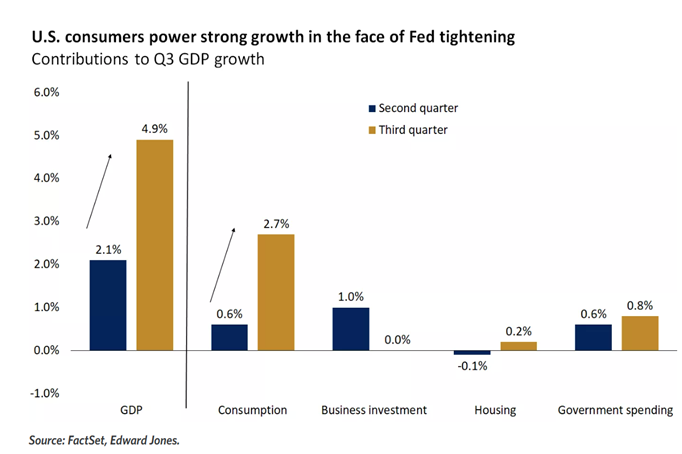
Financial conditions tightened for the 3rd straight month in October but failed to spook the economy. Indeed, October saw a flurry of data signalling the resilience of the US economy, including a blockbuster jobs report, strong retail sales data and a blowout GDP print of 4.9% annualised for the third quarter. The US economy has now been in an expansion for 41 months with annualized real GDP growth of 5%. Inflation came in hotter-than-expected, with the headline figure flat at 3.7% year on year in September, against expectations of a slight moderation.
Contributions to US Q3 GDP growth
Source: FactSet, Edward Jones
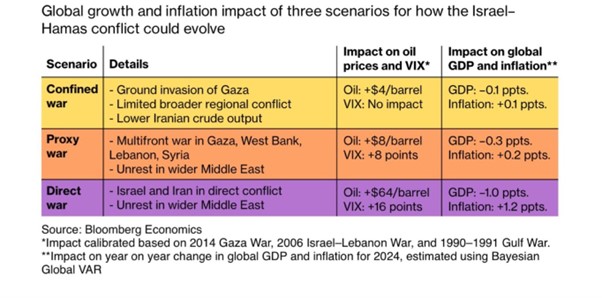
Israel-Hamas conflict is the new “known unknown” investors have to deal with at a time when rising oil prices were already pushing bond yields upward. There are basically three possible developments for how the Israel-Hamas conflict could evolve: 1) confined war; 2) proxy war; 3) direct War.
Out of these three scenarios, a direct war between Israel and Iran is the one which could have a strong impact on markets (sharp increase in oil prices and the VIX) and the economy (drop in GDP and rise in inflation).
Yet, history suggests that geopolitical risks and the associated shock in confidence tend to be short-lived, as markets gravitate toward the more sustainable drivers for returns.
Source: Bloomberg
On October 3rd, The House of Representatives entered uncharted territory after a far-right effort to remove fellow Republican Kevin McCarthy from the speakership succeeded thanks to support from Democrats. A resolution from Republican Matt Gaetz passed with the support of eight Republicans and all the Democrats present and voting. The vote made McCarthy the first speaker in history to be removed from office, less than nine months on the job.
Since then, The House has been without a permanent speaker. Alongside the surge in Treasury issuance, markets seem to progressively increase the risk premium required to invest into US Treasuries. Indeed, US CDS – which is basically the cost to insure yourself against a US sovereign credit event – keeps rising.
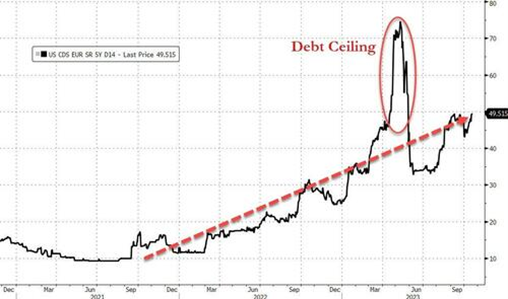
Source: Bloomberg, zerohedge.com
October was a challenging month for investors, with declines across both equities and bonds. Commodities were the notable outperformer, as energy prices rallied, and investors fled to gold as a safe haven.
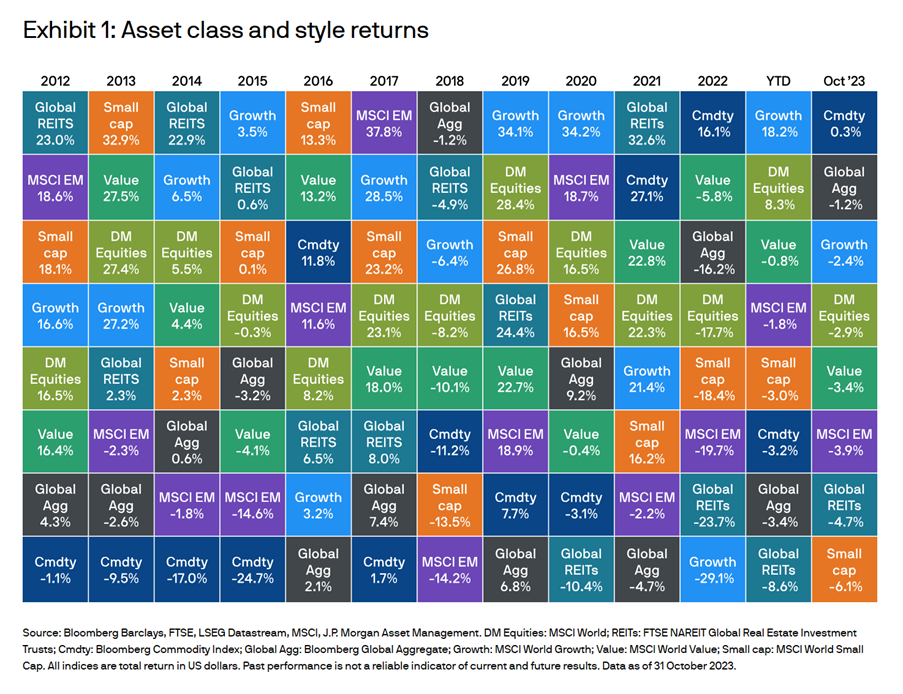
Source: JP Morgan
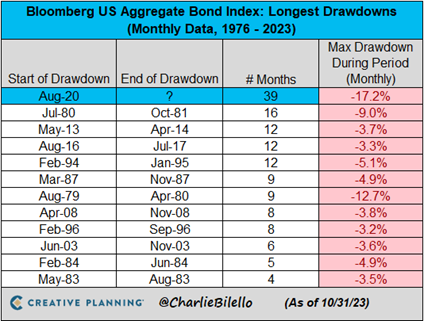
The rout in the bond market continued in October, with global bonds down 1.2% over the month. The US 10-year Treasury yield pushed above 5% for the first time since 2007, driven by a combination of resilient economic data making ‘higher for longer’ rates look increasingly likely and US Treasuries supply/demand imbalances. A move higher in yields was seen throughout the global government bond market and in credit, widening spreads dented monthly returns for both investment grade and high yield bond markets. The yield curve (2s30s) steepened for the 4th month in a row to its highest since July 2022. We note that the US Bond Market has now been in a drawdown for 39 months, by far the longest bond bear market in history.
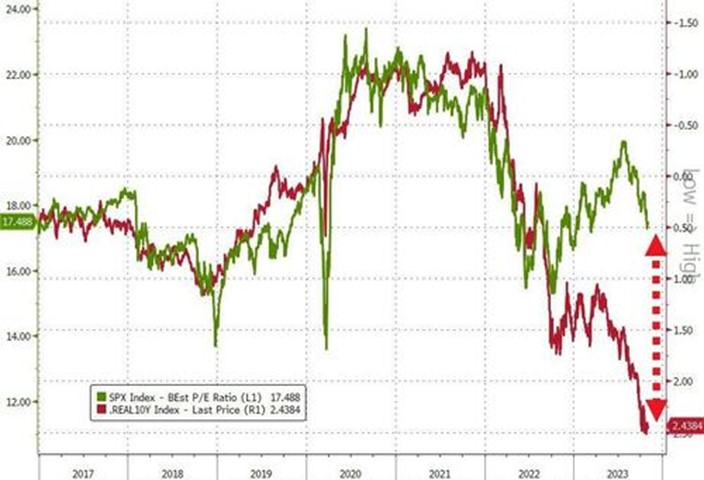
Higher long-term real yields are a headwind to stock valuations. Stocks fell globally in October as the prospect of ‘higher for longer’ rates hurt equity multiples and the Israel-Hamas conflict dampened risk appetite. Developed market equities fell 2.9% on the month, while emerging market stocks fell 3.9%. Growth stocks proved relatively resilient versus their value counterparts, returning -2.4% over the month in comparison to -3.4% for value stocks. Small Caps tumbled over 7% in October, down for the 3rd month in a row and the worst monthly loss since Sept 2022. Nasdaq fell over 2% on the month, also its 3rd straight monthly loss in a row. Despite Israel-Hamas conflict, energy was the biggest sector loser in October alongside consumer discretionary. Utilities were the only sector to end October in the green.
Source: Bloomberg
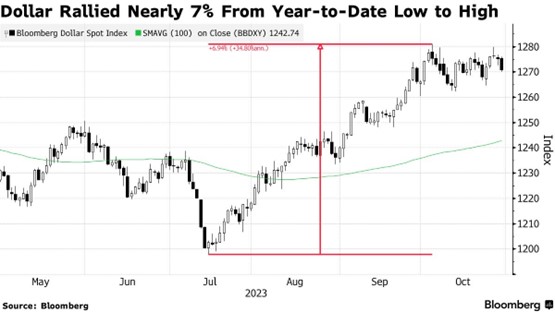
The dollar gained against most currencies in October and is now up 7% since July low. However, we note that a Bloomberg index of the dollar has traded sideways since hitting its year-to-date peak earlier this month, and even US Treasury yields spiking to their highest in more than a decade last week failed to ignite enough momentum for the currency to push higher.
Source: Bloomberg
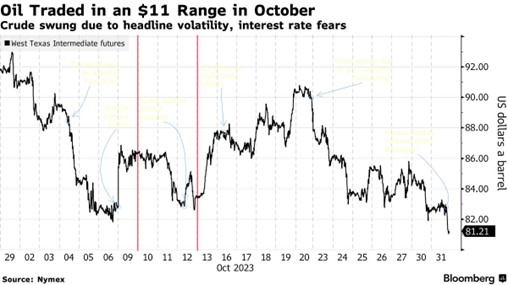
Commodity prices reversed some of their year-to-date losses, with the broad Bloomberg Commodity Index rising 0.3% over October. The tragic events that unfolded in the Middle East led to a flight to safety in gold (see chart #9). Oil prices also rallied amid concerns that an escalation into a wider regional conflict could disrupt oil supply, although the price of WTI Crude Oil was very volatile (see below) and remained below its September peak. Meanwhile, European gas prices rose due to fears over global supply chain disruptions, exacerbated by the sabotage of a gas pipeline in the Baltic sea.
Source: Bloomberg
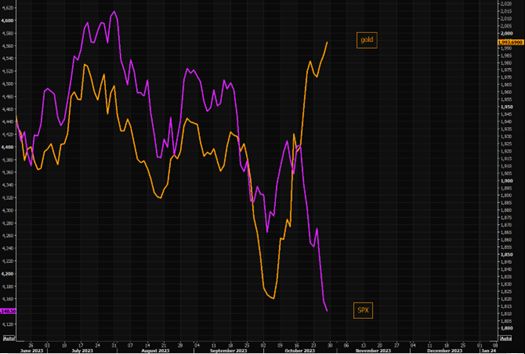
Spot Gold had its best month since March, but futures saw their biggest month since July 2020, starting to ramp as Hamas attacked Israel from $1820 to $2020. For many investors, Gold remains the number one hedge. S&P 500 and gold are moving in opposite directions (see chart below). Interestingly, Gold is now rising along with US Treasury yields, indicating concerns about US fiscal & debt situation. We note that Gold saw its first weekly inflow since May stemming from long-only investors. Meanwhile, the big CTA gold short has turned into net long positions.
Source: TME
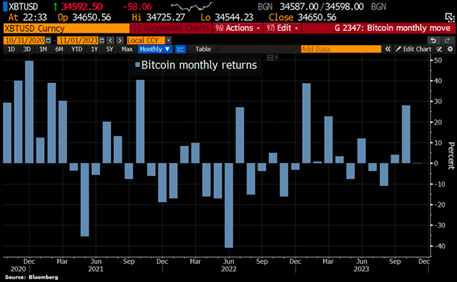
Cryptocurrencies have a short history, but it is nevertheless notable that October is traditionally a strong month for digital assets. It was again the case this year as the vast majority of cryptos soared in October. Solana was the
best performer with a monthly gain of nearly 70%. Bitcoin had its best month since January 2023, surging above $35,000 for the first time since May 2022. Ethereum notably underperformed with a gain of “only” 7%, its biggest monthly underperformance of bitcoin since February 2021.
Source: Bloomberg, HolgerZ
This marketing document has been issued by Bank Syz Ltd. It is not intended for distribution to, publication, provision or use by individuals or legal entities that are citizens of or reside in a state, country or jurisdiction in which applicable laws and regulations prohibit its distribution, publication, provision or use. It is not directed to any person or entity to whom it would be illegal to send such marketing material. This document is intended for informational purposes only and should not be construed as an offer, solicitation or recommendation for the subscription, purchase, sale or safekeeping of any security or financial instrument or for the engagement in any other transaction, as the provision of any investment advice or service, or as a contractual document. Nothing in this document constitutes an investment, legal, tax or accounting advice or a representation that any investment or strategy is suitable or appropriate for an investor's particular and individual circumstances, nor does it constitute a personalized investment advice for any investor. This document reflects the information, opinions and comments of Bank Syz Ltd. as of the date of its publication, which are subject to change without notice. The opinions and comments of the authors in this document reflect their current views and may not coincide with those of other Syz Group entities or third parties, which may have reached different conclusions. The market valuations, terms and calculations contained herein are estimates only. The information provided comes from sources deemed reliable, but Bank Syz Ltd. does not guarantee its completeness, accuracy, reliability and actuality. Past performance gives no indication of nor guarantees current or future results. Bank Syz Ltd. accepts no liability for any loss arising from the use of this document.
The first quarter of 2025 has been a particularly turbulent one for the financial markets: US equities had their worst relative performance in 23 years, Chinese markets rebounded, gold reached new highs and economic and geopolitical uncertainties fuelled volatility. Here are 10 charts that highlight the first three months of the year.
Despite recession concerns, economic growth showed resilience, while equities retreated in October and inflation continued its slow decline. Nuclear energy was poised to power the future of AI, while the market suggested buying "Trump" and selling "Kamala” when referring to U.S. Election bets. Here are 10 charts to review what happened in the markets during October.
The Fed cuts rates, meanwhile Europe teeters on the brink of recession, China ramps up stimulus, and U.S. debt surges. Developed market equities surge amid global challenges, while fixed income rallies on easing rate expectations. Each quarter, the Syz investment team takes you through the last 3 months in 10 charts.
Live feeds, charts, breaking stories, all day long.
Our latest research, commentary and market outlooks