Charles-Henry Monchau

Chief Investment Officer

Chart #1 — 

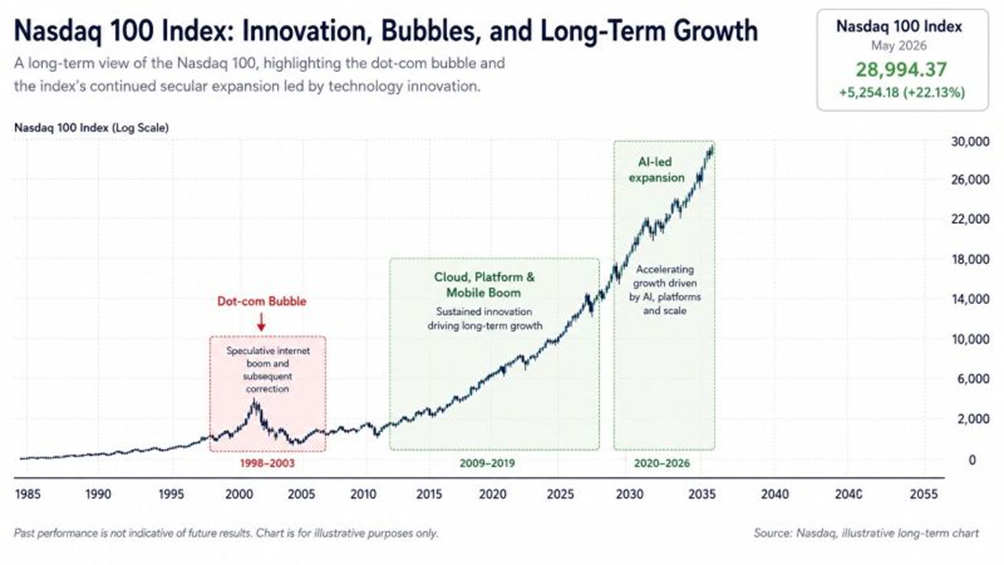
What a journey for the Nasdaq 100...

If you had put $10,000 into the Nasdaq 100 ETF $QQQ right at the dot-com bubble's worst moment in March 2000, that money would have grown to roughly $61,650 today, a return of +516%, or about +7.2% per year.

This is despite enduring 9/11, the recession of 2001–2002, the Global Financial Crisis, the COVID-19 pandemic, and major geopolitical upheaval like the Russia-Ukraine war and ongoing Middle East tensions.

It recalls one of Warren Buffett's most iconic lines: "Never bet against America."


Source: Rand Group


Chart #2 — 

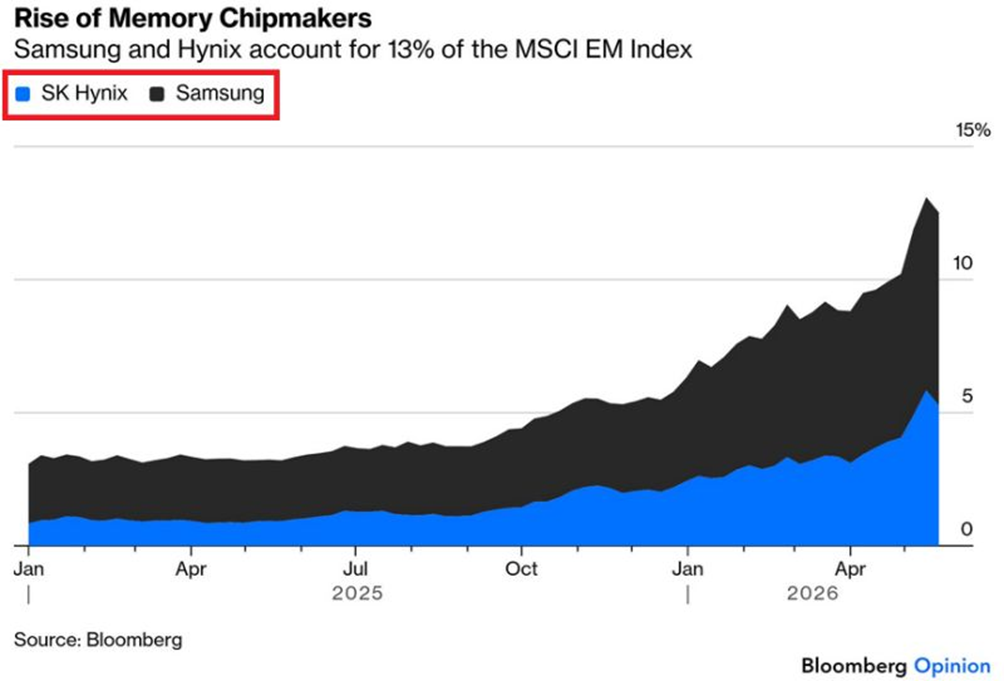
The MSCI Emerging Markets index is becoming very concentrated

Samsung and SK Hynix together make up roughly 13% of the MSCI Emerging Markets Index, a benchmark that guides over $1 trillion in managed assets. SK Hynix on its own now carries a weighting that rivals Tencent and Alibaba combined, after more than doubling in market value this year alone. Add TSMC to the mix, and these three chipmakers represent over a quarter of the entire index, having driven more than 70% of its gains so far in 2026.

It is a situation that echoes late 2020, when Chinese stocks ballooned to over 40% of the same index. When that trade unraveled, Chinese equities peaked in February 2021 and then cratered, the broader emerging markets index was dragged into a 15–16-month bear market, shedding roughly half its value from top to bottom. Even supposedly diversified emerging market indexes can carry surprisingly dangerous levels of concentration.

Source: Global markets Investors, Bloomberg Opinion


Chart #3 — 

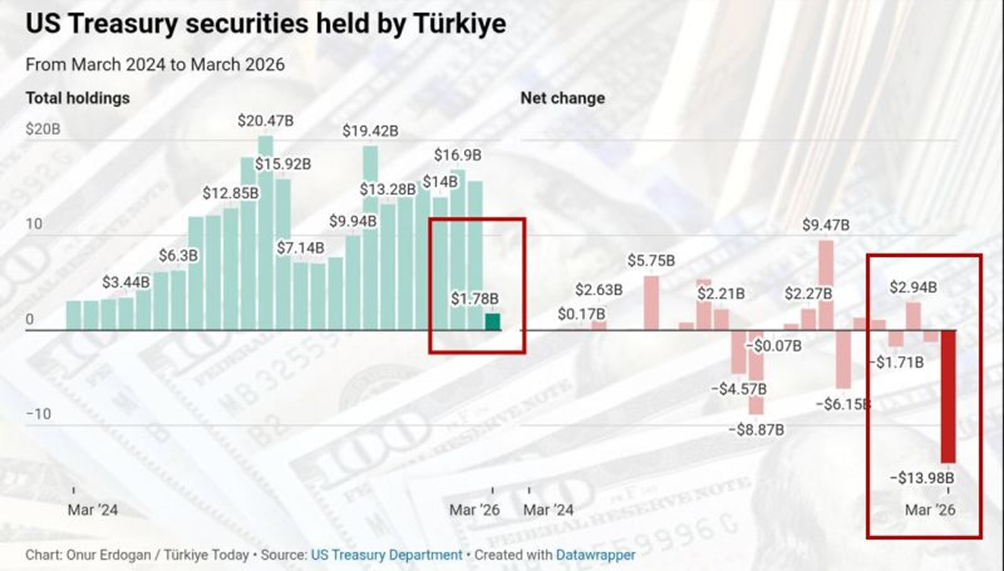
Massive liquidation of US Treasuries by Turkey in March

In March, Turkey offloaded nearly all its U.S. Treasury holdings, slashing them from roughly $16 billion to just $1.8 billion, a reduction of close to 89, as authorities scrambled to prop up the lira as a severe external shock took hold.

What drove it:

  • The trigger was the Middle East conflict and the oil price spike that followed. Since Turkey is heavily dependent on imported energy, surging oil costs deepened its current-account deficit and piled further pressure on the currency.

  • This was a liquidity move, not a geopolitical statement. Turkey urgently needed U.S. dollars, and Treasuries, being the most liquid reserve asset in the world, were the obvious thing to sell.
  • At the same time, the Turkish central bank hiked overnight rates to 40% as the lira came under sharp pressure, with USD/TRY trading in the 44.5–45.6 range during the period.
  • Perhaps the most telling detail: Turkey reportedly sold both Treasuries and gold reserves simultaneously. As Treasuries are typically used as collateral rather than sold outright, offloading both points to acute financial distress, not routine reserve management.
  • Analysts tied broader emerging-market reserve sales to the steep drop in gold prices from near-record levels.
  • Despite the scale of the move, Turkey remains a relatively minor Treasury holder compared to regional peers like Saudi Arabia and the UAE, making this episode more significant as a gauge of Turkey's financial fragility than as any kind of threat to U.S. debt markets.
  • It is also worth noting that Turkey's Treasury holdings had already been eroding for years, down from around $80 billion a decade ago.

This was a classic emerging-market balance-of-payments and currency-defense dynamic, liquidating reserve assets to get dollars fast, not a philosophical break from the dollar system. It matters as a stress signal for Turkey, but not as a broader market event. Total foreign Treasury holdings fell only about 1.5% in March, with Japan and China leading that decline.


Source: Hedgeye


Chart #4 — 

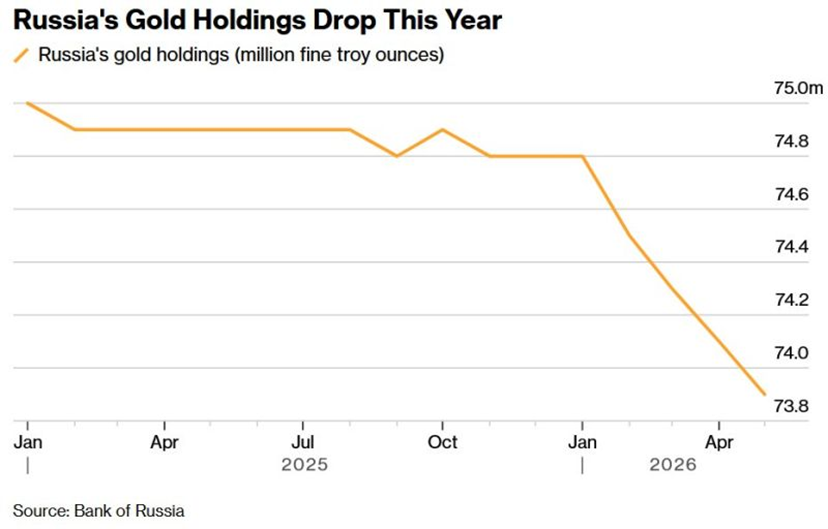
Russia is dumping its gold

Russia, once one of the largest sovereign accumulators of gold, has sold more than $4 billion of its reserves this year, bringing its holdings down to the lowest level since the invasion of Ukraine began. This move is largely explained by fiscal pressure: energy revenues are no longer sufficient to cover war-related expenditures, forcing the government to tap into its reserves. The sales are occurring at historically high gold prices, which softens the financial impact, although it also highlights the urgency of the budget gap.

Source: Bank of Russia, Bloomberg


Chart #5 — 

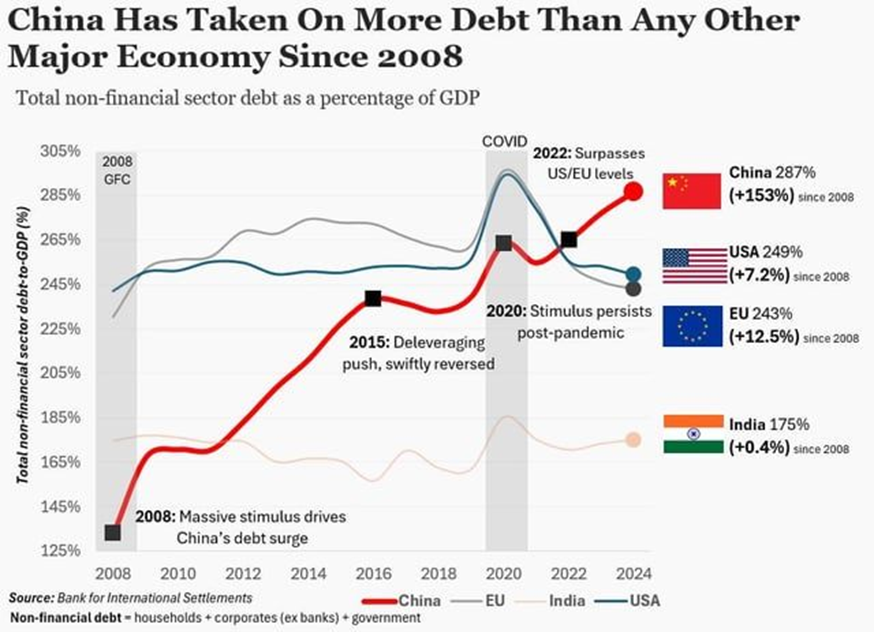
If China wants to surpass the US, it needs to become far better in capital allocation

Over the past four decades, China has consistently invested around 40% of its GDP annually, largely through state-owned enterprises and local government projects. This level of investment far exceeds historical benchmarks, including even the Soviet Union during its most intensive industrial periods. However, the efficiency of these investments appears to have declined over time. Whereas such spending generated around 10% annual growth two decades ago, it now produces closer to 4%, with projections suggesting around 3% by 2030.


Source: Bank of International Settlements 


Chart #6 —

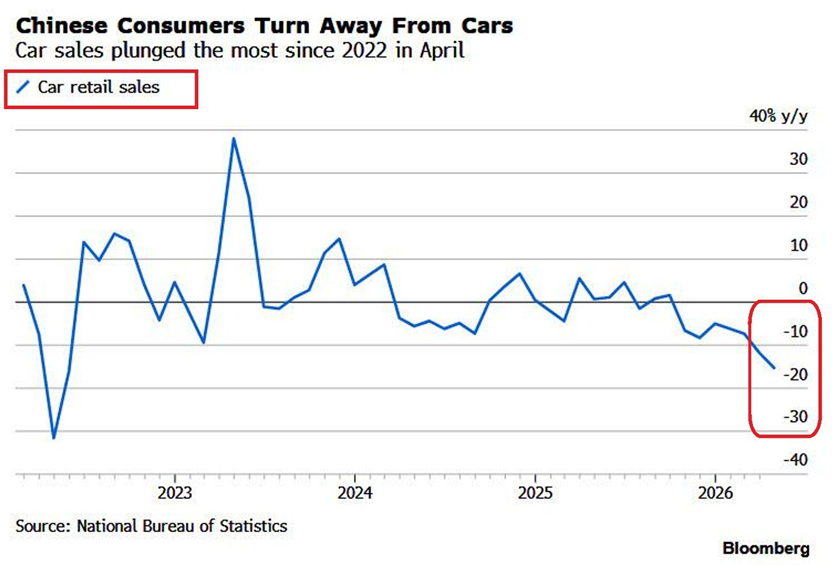
What is happening in China?

April data point to a broad slowdown in Chinese domestic demand. According to China’s National Bureau of Statistics, car retail sales fell 15% YoY, the sharpest decline since mid-2022. The weakness extended beyond autos: home appliances and furniture purchases declined at a double-digit pace, while gold, silver and jewelry sales dropped 21% YoY. Overall retail sales rose by just 0.2% YoY in April, the weakest reading since December 2022. Fixed-asset investment also fell 1.6% over the first four months of 2026, moving back into contraction territory. This suggests China’s GDP growth could slow to around 4.1% YoY in Q2 2026, below Beijing’s official 4.5%–5.0% growth target. In short, China’s economy is losing momentum, with consumer demand and investment both under pressure.

Source: Global Markets Investor


Chart #7 — 

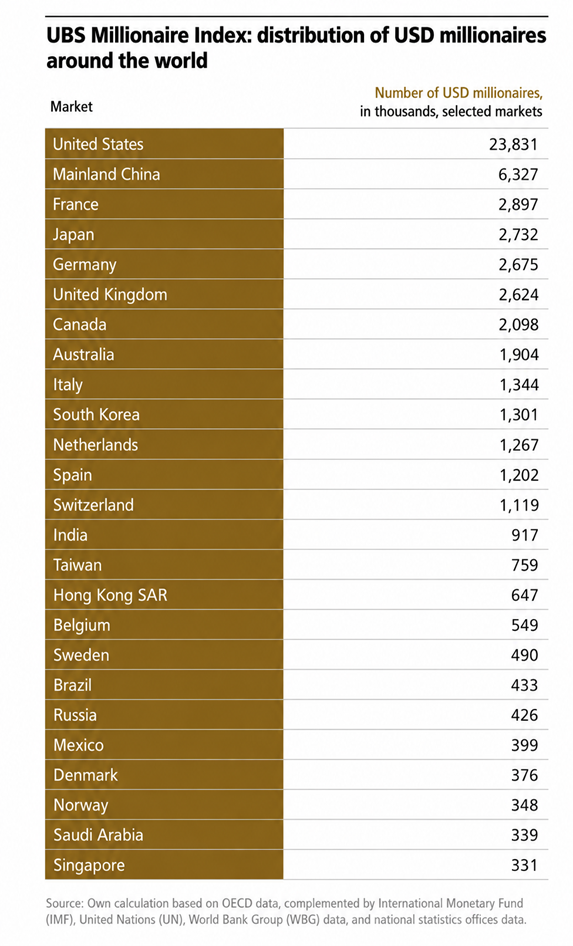
1 in 8 people in Switzerland is a US dollar millionaire

According to the UBS Millionaire Index, Switzerland ranks first by the estimated share of the population holding at least USD 1 million in wealth.

• Switzerland: 12.4%

• Hong Kong: 8.6%

• United States: 7.1%

• Netherlands: 7.0%

• Singapore: 5.5%

• United Kingdom: 3.9%

• Germany: 3.2%

• Japan: 2.2%

• China: 0.4%

• India: 0.06%


Source: UBS


Disclaimer

This marketing document has been issued by Bank Syz Ltd. It is not intended for distribution to, publication, provision or use by individuals or legal entities that are citizens of or reside in a state, country or jurisdiction in which applicable laws and regulations prohibit its distribution, publication, provision or use. It is not directed to any person or entity to whom it would be illegal to send such marketing material. This document is intended for informational purposes only and should not be construed as an offer, solicitation or recommendation for the subscription, purchase, sale or safekeeping of any security or financial instrument or for the engagement in any other transaction, as the provision of any investment advice or service, or as a contractual document. Nothing in this document constitutes an investment, legal, tax or accounting advice or a representation that any investment or strategy is suitable or appropriate for an investor's particular and individual circumstances, nor does it constitute a personalized investment advice for any investor. This document reflects the information, opinions and comments of Bank Syz Ltd. as of the date of its publication, which are subject to change without notice. The opinions and comments of the authors in this document reflect their current views and may not coincide with those of other Syz Group entities or third parties, which may have reached different conclusions. The market valuations, terms and calculations contained herein are estimates only. The information provided comes from sources deemed reliable, but Bank Syz Ltd. does not guarantee its completeness, accuracy, reliability and actuality. Past performance gives no indication of nor guarantees current or future results. Bank Syz Ltd. accepts no liability for any loss arising from the use of this document.

Read More

Straight from the Desk

Syz the moment

Live feeds, charts, breaking stories, all day long.

Thinking out loud

Sign up for our weekly email highlighting the most popular posts.

Follow us

Thinking out loud

Investing with intelligence

Our latest research, commentary and market outlooks