


.png)
A recent Federal Reserve note offers one of the clearest accounts of how the AI infrastructure cycle feeds into growth, and where the data still fall short. Its centrepiece tracks quarterly capital expenditure by the largest US tech firms using SEC filings. The acceleration since 2024 is hard to miss.
What hyperscaler capex captures
The chart below uses purchases of property and equipment reported in company filings. It is useful, but can both understate and overstate AI-related spending.
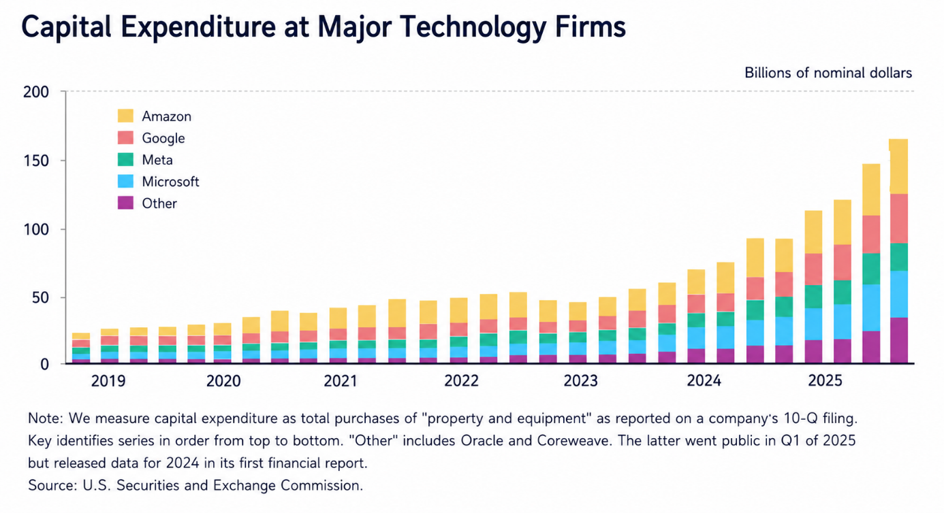 It understates investment by excluding wider economic effects: data centre construction generates revenue for contractors, utilities and equipment manufacturers, while the capex figure captures only the initial outlay. It may also miss capacity leased from third-party operators.
It overstates by including non-AI spending. Amazon remains the largest capital spender, but much of its investment supports fulfilment and logistics rather than AI; servers and networking made up only around a third of its gross property, plant and equipment at end-2025.
There is no dedicated AI investment line in filings or national accounts, so any precise estimate rests on assumptions. Three indicators help: hyperscaler capex (broad but noisy), Census private data centre construction (a leading indicator, but buildings are only part of project value), and BEA NIPA computer equipment spending (hard to separate from ordinary office IT).
|
Indicator |
What it captures |
The problem |
|
Hyperscaler capex |
Data centre structures, land, servers, networking equipment |
Includes non-AI spending and may exclude leased capacity |
|
Census private data centre construction |
Physical structures |
A leading indicator, but buildings represent only part of the project’s value |
|
BEA NIPA computers and peripheral equipment |
Servers and equipment inside the buildings |
Includes ordinary office computers, making the AI component difficult to isolate |
Source: FEDS Notes
The contribution to US growth
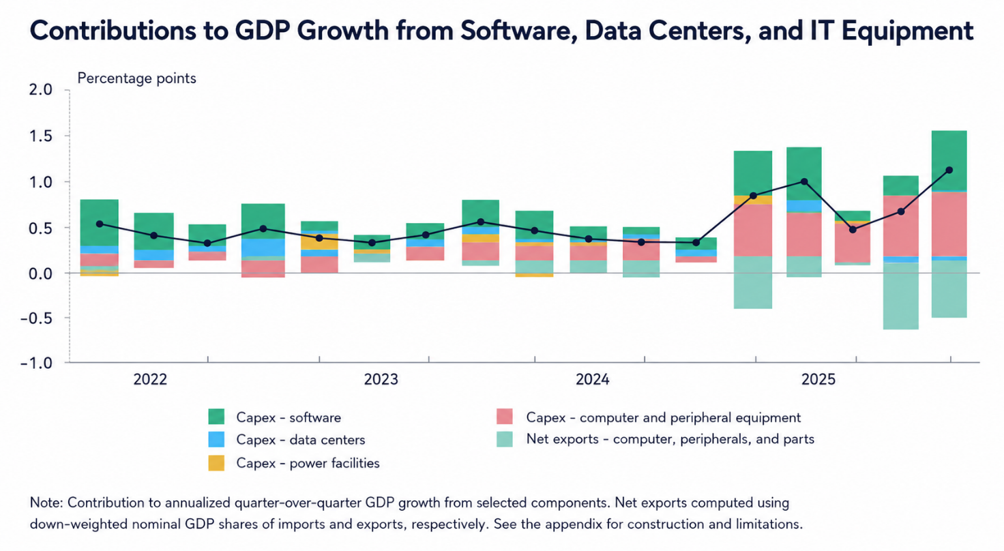
On a gross basis, current technology investment could add close to one percentage point to 2026 US GDP growth, concentrated among a handful of firms.
The Fed's estimate is more conservative, combining software, data centre, power, and computing investment, then adjusting for the associated rise in imports. Software and computing equipment have driven the largest gains since 2025, but much of the equipment is imported, so net exports offset part of the domestic investment boost.
Gross investment is therefore large, while the net GDP contribution is more uneven, reflecting import content and measurement limits rather than doubts about the cycle's strength.
Source: Fed
The buildout is visible, the payoff is not
The paper doesn't link the cycle directly to geopolitics, but it helps explain the US economy's resilience in 2026. Hyperscaler programmes are approved years ahead and backed by long-term contracts, making them less sensitive to short-term shocks than typical corporate spending. Data centres remain exposed to electricity prices, and high import content limits the direct GDP benefit, but the programmes stay relatively insulated from short-term volatility.
A slowdown in capex could mean demand has been satisfied, returns have fallen, or financing has tightened, though spending could stay elevated even as construction plateaus, shifting instead towards servers, software and operating costs.
The note also stresses that technical feasibility differs from economically viable deployment. Falling marginal costs of running models matter less than the fixed cost of integrating them: cleaning data, redesigning processes and connecting legacy systems. Token prices are therefore an incomplete gauge, since public rates, contract terms and model efficiency all vary.
Hardware costs have fallen, but high-bandwidth memory is emerging as a key constraint. The Fed uses Korean semiconductor export prices as a proxy, given Samsung and SK Hynix's dominance in DRAM and HBM production, making memory prices a indicator worth watching.
Adoption is rising, especially among larger firms, but usage intensity looks shallower than headline adoption suggests. Productivity evidence remains inconclusive: AI-exposed sectors show somewhat stronger growth, but the gap hasn't widened decisively, possibly reflecting lagged effects, bottlenecks elsewhere, or gains that classical statistics simply miss.
The labour market offers no clear verdict
Aggregate unemployment shows little sign of broad AI-driven displacement. Early effects may instead show up as weaker recruitment, particularly for entry-level roles, making job openings more informative than layoff claims. This matters because junior roles build the skills needed for career progression.
Conclusion
The AI investment cycle is larger than headline capex suggests once leased capacity is included, but smaller once imports and non-AI spending are stripped out. It has helped cushion the US economy through geopolitical and energy stress because the projects are long-term and relatively insulated from short-term confidence shocks. The economic payoff, however, remains unresolved: investment is visible everywhere in the data, but broad productivity gains are not yet.