Charles-Henry Monchau

Chief Investment Officer

Chart #1 — 

The “everything bull market”


Markets closed November in a positive mood thanks to tentative signs of economic moderation in the US and falling inflation across developed markets. Data releases broadly supported the view that central banks have reached the peak of their tightening cycles, aiding both equities and fixed income.
Global bond and stock markets added over $11 trillion in capitalization in November. That is the second biggest monthly gain in history (November 2020 added $12.5 trillion). 
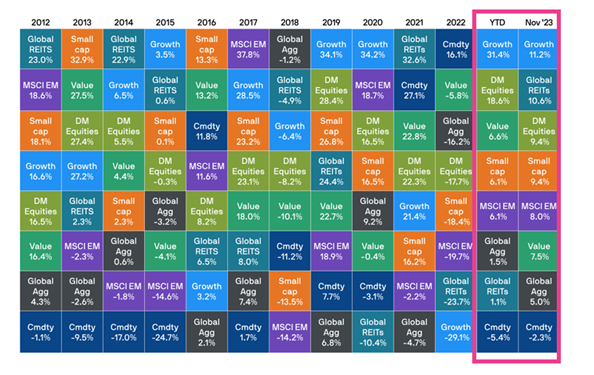
US Growth stocks (+11.2%) outperformed US small caps (+9.4%) and US value (+7.5%) while developed equity markets (+9.4%) outperformed emerging markets equities (+8.0%). In emerging markets, MSCI China’s 2% gain in November supported the MSCI Emerging Markets Index, which grew 8% over the month and is now up 6% year-to-date.
The MSCI Europe ex-UK Index gained 7% over the month, with the financial sector in particular benefitting from stronger interest margins and profits.
Japan continued to be the year’s top performer, up 5% in November and 29% year-to-date. 
From a US sector perspective, The energy sector was the only one to end the month in the red while Technology and Real Estate were the big winners.
M10C_231207_p01

Source: JPMorgan

The Global Bonds Aggregate index was up 5% over the month. Commodity prices (-2.3% in November) contracted from their October peaks. Despite the ongoing conflict in the Middle East, the price of a barrel of Brent crude oil fell to $80, in part thanks to an increase in US supply and OPEC+ members’ failure to adhere to production quotas.
With the exception of commodities, all main asset classes are back in positive territory on a year-to-date basis.


Chart #2  — 

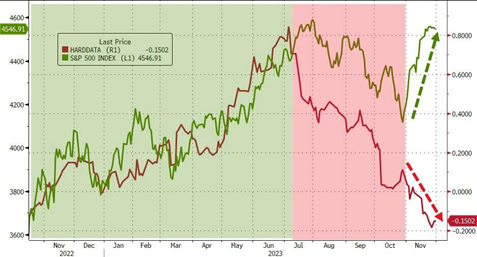
Bad (macro) news is good news

November was truly a month of "bad news" being "good news" for stocks (and bonds). US 'Hard' data hits a 14-month low as stocks surge back near record highs. Indeed, while economic data remained resilient, there were some signs that the US economy is cooling. Initial and continuing jobless claims rose modestly and credit card delinquencies continued to pick up. Retail spending fell modestly in October, suggesting consumers are moderating their spending patterns after a strong run through the middle of the year. The market was particularly encouraged by the release of the US Consumer Price Index (CPI) reading for October, which was cooler than expected. Headline and core inflation dropped to 3.2% year-on-year (y/y) and 4.0% y/y respectively. 

M10C_231207_p02

Source: Bloomberg, zerohedge.com


Chart #3  — 

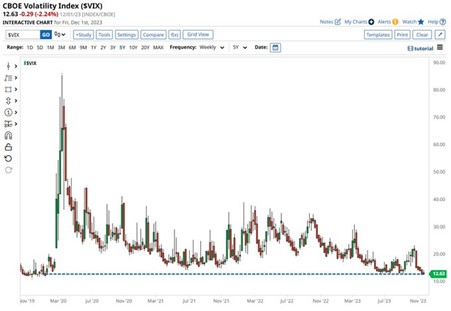
The plunge in volatility

CBOE Volatility Index $VIX falls to its 2nd lowest level since January 2020 which suggests high investors’ complacency. Some investors are worried about the VIX index being too low (i.e markets are too complacent). However, let’s keep in mind that a "low VIX" is a normal part of bull markets.

M10C_231207_p03

Source: Bloomberg, zerohedge.com


Chart #4 — 

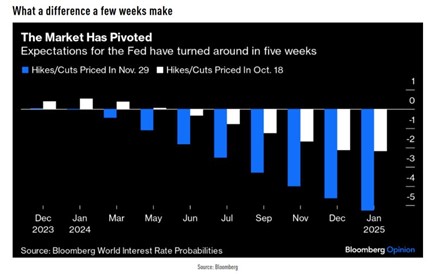
Deep interest rates cuts are now being priced in for 2024

November saw the biggest increase in US rate-cut expectations for 2024 since November 2022. Odds of rate cuts beginning as soon as January 2024 are rising quickly. There is now a ~15% chance of rate cuts beginning next month. The base case shows a ~56% chance of rate cuts beginning in March 2024. Markets are currently expecting a total of FIVE 25 basis point rate cuts in 2024. Still, the Fed has yet to discuss the possibility of any rate cuts at all. Markets are fully bought in to the "Fed pivot."

M10C_231207_p04

Source: Bloomberg


Chart #5 — 

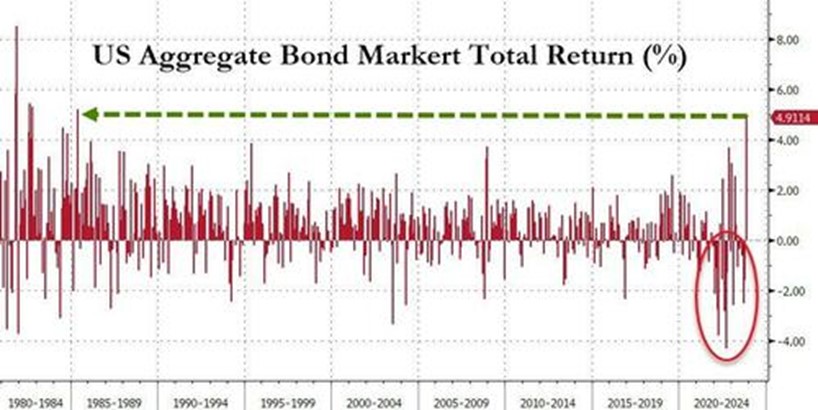
Best month for global bonds since December 2008 


Government bond yields declined over the month. The US 10-year Treasury yield fell below 4.4% by the end of November, down from the peak of 5% reached in mid-October. In Europe, the German 10-year yield fell around 20 basis points, and the BTP-Bund spread tightened slightly after a positive ratings update for Italian sovereign debt.
The Global bonds index had its best month since December 2008 with US bonds soaring to their best month since May 1985 and is now back into the green for the year (+2%).
For context, that is a 60bps or so collapse in yields for Treasury bonds on the month (with the short-end underperforming). The 5% yields on the 10-year Treasury have suddenly become a distant memory.
Outside of sovereign bonds, the entire fixed income market benefited from lower yields and more rate cuts expected in 2024. Investment grade bonds gained, and rising hopes for a soft landing supported high yield bonds where spreads tightened.

M10C_231207_p05

Source: Bloomberg, zerohedge.com


Chart  #6 — 

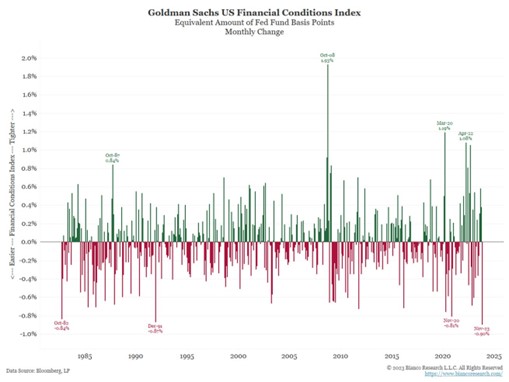
A dramatic loosening of financial conditions 

The rally in bonds and stocks is making financial conditions dramatically looser. October saw the biggest absolute monthly loosening in financial conditions in history (back in 1982). Should Powell and the Fed turn dovish too soon, financial conditions could become even looser and this could become counterproductive for the Fed (i.e it would threaten the Central Bank’s fight against inflation).

M10C_231207_p06

Source: Bianco Research


Chart #7 — 

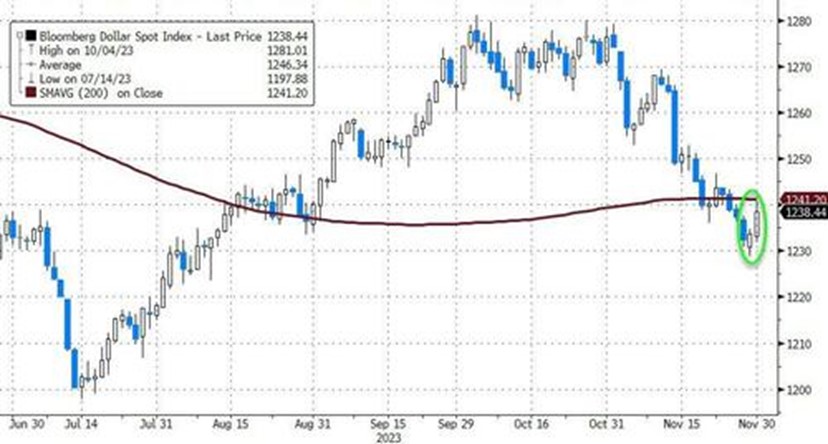
The US dollar tumbled

The drop in interest rates expectations and the weakening of hard macro data pushed the greenback lower. The dollar index tumbled 3% in November - its biggest monthly decline since Nov 2022 (and 2nd biggest since July 2020). Note that Positioning remains a headwind for the greenback; hedge funds now have the largest long position in the US Dollar since February 2022.

M10C_231207_p07

Source: zerohedge.com, Bloomberg


Chart #8 — 

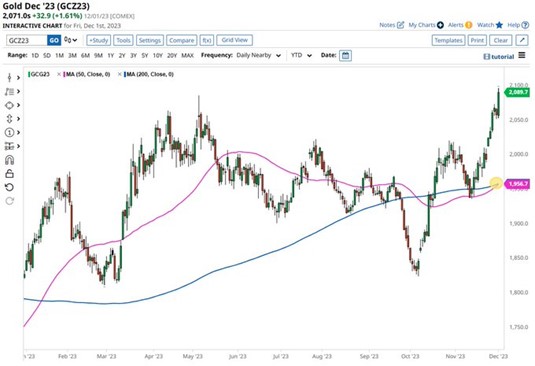
Gold surged and is back to record highs


The biggest winner by far from the month’s final week was gold, which briefly rose above its all-time high of $2,075.  The strength in Gold is confirmed by Silver, which jumped to its highest price since early May with an 8-day winning streak on the most active contract.

M10C_231207_p08

Source: Bartchart


Chart #9 — 

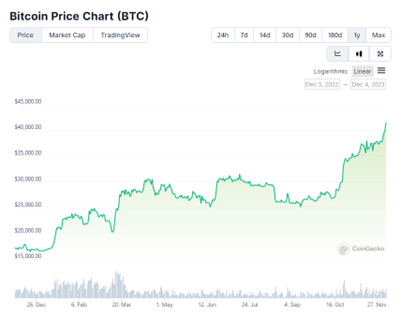
Bitcoin rallied for the 3rd month in a row


Bitcoin rallied for the 3rd month in a row. Amid the surging inflows, and amid expectations for imminent ETF approval by the SEC, Bitcoin has continued its furious ascent, trading above $41k at the start of December. 
Ethereum soared over 12% in November - its best month since March and its first monthly outperformance of BTC since May.

M10C_231207_p09

Source: Coingecko


Chart #10 — 

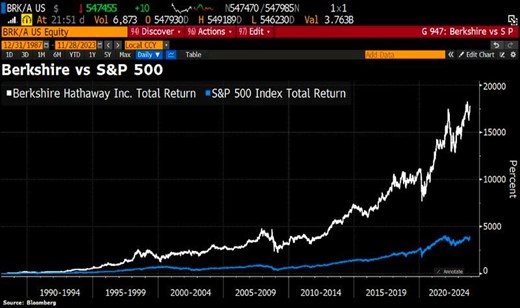
A tribute to Charlie Munger

Charlie Munger, who just passed away a few days before his 100-year birthday, helped Buffett, who was seven years his junior, craft a philosophy of investing in companies for the long term. Under their management, Berkshire averaged an annual gain of 20.1% from 1965 through 2021 — almost twice the pace of the S&P 500 Index.
Berkshire has had a succession plan since at least 2006 when Buffett, then 75, told shareholders the company he has run since 1965 would be prepared for his departure. Berkshire Vice Chairmen Greg Abel and Ajit Jain, who respectively oversee its non-insurance and insurance businesses, are the 93-year-old Buffett's top advisers and sounding boards. Munger inadvertently signalled during Berkshire's 2021 annual meeting that Abel, a 61-year-old Edmonton, Alberta native who spent a quarter century at what is now Berkshire Hathaway Energy, was the CEO designate. Jain, 72, would retain oversight of insurance operations.
Note that Berkshire is currently trading at an approximate -15% discount to NAV, which has been fairly stable historically.

M10C_231207_p10

Source: Bloomberg


Disclaimer

This marketing document has been issued by Bank Syz Ltd. It is not intended for distribution to, publication, provision or use by individuals or legal entities that are citizens of or reside in a state, country or jurisdiction in which applicable laws and regulations prohibit its distribution, publication, provision or use. It is not directed to any person or entity to whom it would be illegal to send such marketing material. This document is intended for informational purposes only and should not be construed as an offer, solicitation or recommendation for the subscription, purchase, sale or safekeeping of any security or financial instrument or for the engagement in any other transaction, as the provision of any investment advice or service, or as a contractual document. Nothing in this document constitutes an investment, legal, tax or accounting advice or a representation that any investment or strategy is suitable or appropriate for an investor's particular and individual circumstances, nor does it constitute a personalized investment advice for any investor. This document reflects the information, opinions and comments of Bank Syz Ltd. as of the date of its publication, which are subject to change without notice. The opinions and comments of the authors in this document reflect their current views and may not coincide with those of other Syz Group entities or third parties, which may have reached different conclusions. The market valuations, terms and calculations contained herein are estimates only. The information provided comes from sources deemed reliable, but Bank Syz Ltd. does not guarantee its completeness, accuracy, reliability and actuality. Past performance gives no indication of nor guarantees current or future results. Bank Syz Ltd. accepts no liability for any loss arising from the use of this document.

Read More

Straight from the Desk

Syz the moment

Live feeds, charts, breaking stories, all day long.

Thinking out loud

Sign up for our weekly email highlighting the most popular posts.

Follow us

Thinking out loud

Investing with intelligence

Our latest research, commentary and market outlooks