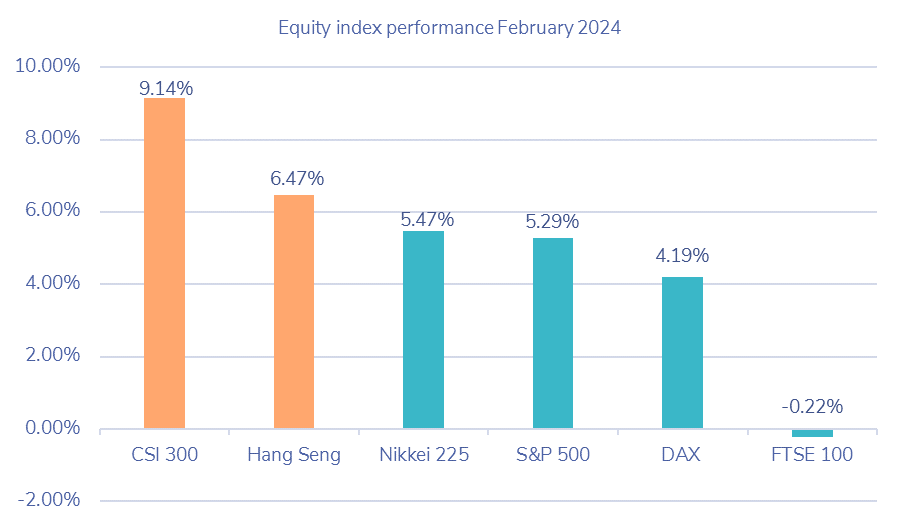
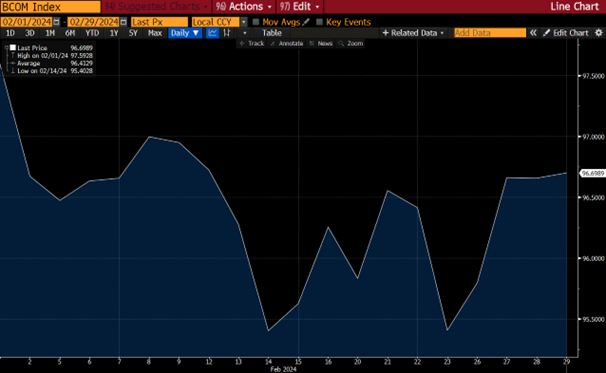
Charles-Henry Monchau

Chief Investment Officer

Chart #1 — 

Stock markets reported a fairly positive month, supported by strong economic data and relatively high earnings.


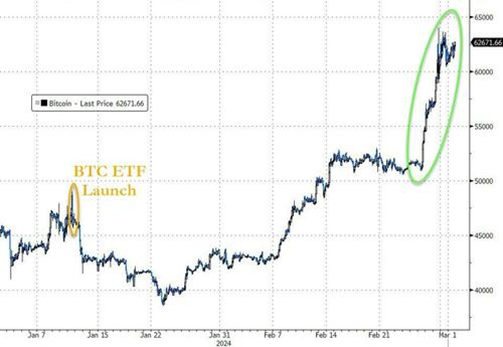
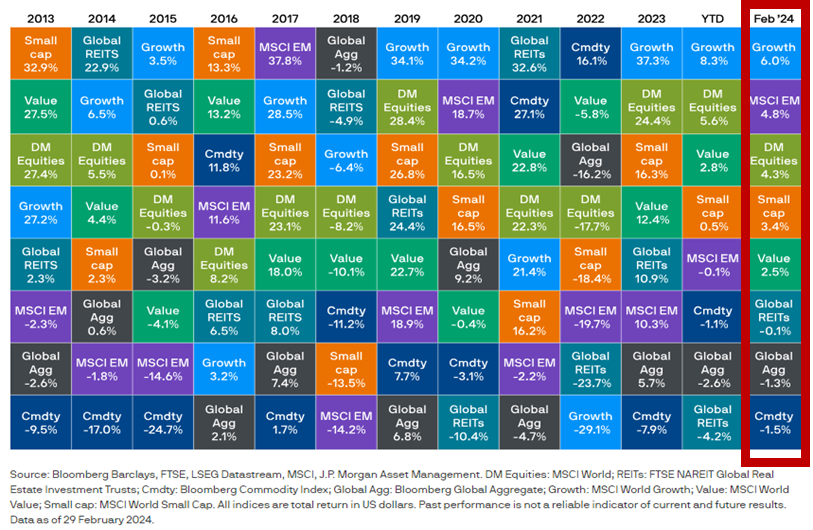
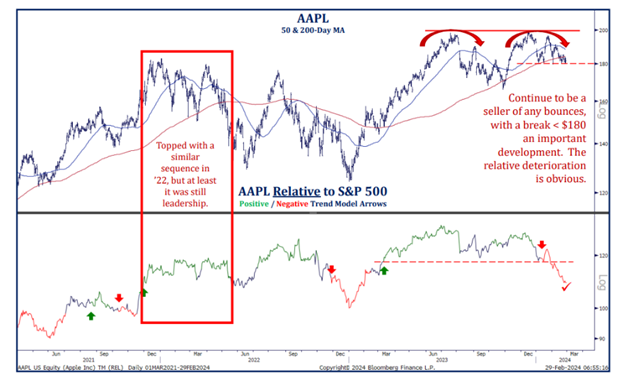
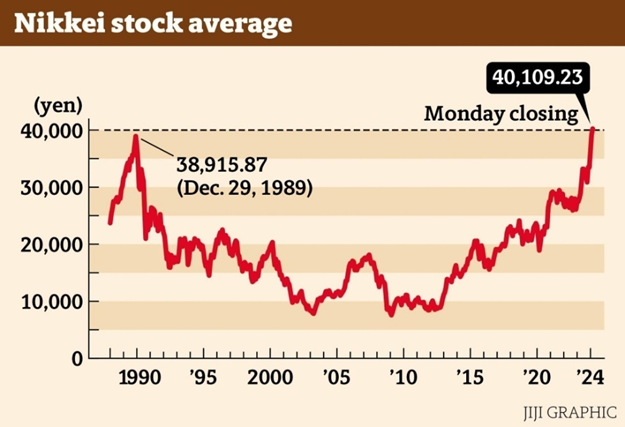
February witnessed a fairly good performance in equity markets. Stocks demonstrated resilience, buoyed by strong economic indicators and robust earnings reports. Five of the Magnificent seven stocks reported their earnings for the previous quarter. These companies largely met or exceeded expectations. Over 90% of S&P 500 companies reported earnings, and nearly three-quarters of them exceeded analysts' forecasts. This bolstered the S&P 500, which surged 5.3% for the month. The index has gained 25% since October 27, representing $8 Trillion in market capitalization and has rallied 130% since the March 2020 low. Japan's Nikkei 225 Index soared to a historic high, contrasting with lagging UK stocks. Emerging markets, particularly China, rebounded driving a 4.8% increase, while European markets struggled to keep pace. The MSCI Europe ex-UK index gained 2.8% in February, compared with 4.3% for the MSCI World index of developed markets. Growth stocks outperformed value, reflecting ongoing market trends.

Source: JP Morgan


Chart #2  — 

NVIDIA is the 3rd largest public company in the world with a $2.05 Trillion market cap.

Nvidia, $NVDA, surpassed Saudi Aramco to claim the position of the 3rd largest public company in the world, boasting an impressive $2.05 Trillion in market cap. On February 22, 2024, it broke a record by adding a jawdropping $277 billion in a single day, following quarterly results that exceeded expectations. Propelled by growing investor interest in AI-driven technologies, Nvidia is currently trailing by approximately 35% behind surpassing Apple.

Source: The Kobeissi Letter


Chart #3  — 

Once the world's most valuable company, Apple’s stock is dropping amidst downward trends and strategic shifts.

Apple, the second largest stock globally, is facing a downturn in its stock value. Having peaked at $200 in December, AAPL has since embarked on a downward trajectory, marked by consecutive lower highs. The $185 support level, a stronghold for two months, crumbled amidst a bearish gap, with Apple's stock plummeting to $170 and showing no signs of recovery. One of the main reasons for the bearish reversal is the decision to abandon its ambitious plans to venture into the electric vehicle (EV) market by launching a self-driving car. Referred to it as "Project Titan", the Applecar was intended to resemble an MPV shuttle, albeit never publicly confirmed by Apple. The decision to cancel the project was announced internally, according to Bloomberg. Some 2,000 employees were involved in the project and will be reallocated to the company’s AI projects.

Adding fuel to the fire, on Monday March 4, 2024, the EU Commission imposed a fine of 1.8 billion euros ($1.95 billion) on Apple for allegedly exploiting its dominant position in the distribution of music streaming apps.

Source: Strategas


Chart #4 — 

Japan equity markets surged to historic heights.

Japan's Nikkei 225 Index extended its rally into February, surging past the coveted 40,000 milestone for the first time in 30 years. Following five consecutive weeks of gains, the index soared beyond its previous intraday peak of 39,990.23 reached just days prior, peaking at an impressive 40,314.64, on Monday 04.03.2024, before experiencing a slight pullback in the afternoon session. This achievement underscores Japan’s resilience and the growing optimism surrounding its economy among investors worldwide.

Source: JIJI Graphic


Chart #5 — 

Chinese equities soar amidst year of the Dragon.


Having plummeted to five-year lows prior to the month, Chinese equity markets experienced a remarkable turnaround in February. The MSCI China Index surged by an impressive 8.6% over the course of February. The onshore CSI 300 index surged by over 9% in USD terms, while the Hang Seng index saw a gain of more than 6%, outperforming all other major equity markets for the month. Adding fuel to the recovery, the Chinese government implemented a series of supportive measures, including a reduction in the 5-year loan prime rate, restrictions on short selling, and intervention through stock purchases by state-owned investment entities. Representing luck and fortune, one may think that the year of the wood Dragon brought renewed optimism to investors.


Chart  #6 — 

Fed rate cut expectations diminish. 

Amidst evolving market dynamics, there’s a notable shift in sentiment regarding the Federal Reserve policy, with the “rates staying high for longer” gaining traction. Notably, the financial institution Apollo has made a bold prediction, asserting that the Fed will refrain from cutting rates throughout the 2024 year, signaling a prolonged period of higher rates. Apollo maintains that the US economy shows no signs of slowing down. Indicators pointing to a potential resurgence in inflation, with measures such as Supercore inflation standing at 4.5%, further reinforce this position. This stands in stark contrast to the sentiment just two months prior, when markets were pricing in expectations of up to six rate cuts in 2024.

Source: CME Group


Chart #7 — 

Fixed income markets faced a squeeze with deferred rate cut expectations.

Throughout February, fixed income markets encountered challenges as investors deferred expectations for interest rate cuts well into 2024. This shift in sentiment exerted downward pressure, evident in the 1.3% decline in US Treasuries. However, amidst this backdrop, less rate-sensitive high yield bond markets managed to outperform, offering a glimmer of resilience in an otherwise gloomy fixed income landscape.


Source: Boursorama


Chart #8 — 

Commodities face headwinds amidst economic uncertainty and geopolitical risks.


February witnessed a downturn in commodities, with the broad Bloomberg Commodity Index declining by 1.5%. The ongoing drop in gas and agricultural prices underscored the challenges faced by the commodity market amidst lingering cost pressures and elevated interest rates impacting consumers and businesses globally. As subdued economic activity persists, the demand for commodities is expected to soften further.

 Adding to the complexity, escalating geopolitical tensions, notably the Red Sea security crisis and the Russia-Ukraine war, pose a significant threat to commodity supply chains. Despite these challenges, crude oil has shown resilience, testing a key resistance level at $79.71. Notwithstanding previous attempts to breach this level, the current trend indicates an upward trajectory, offering a glimmer of optimism amidst the general market uncertainty.

Source: Bloomberg 


Chart #9 — 

Gold is flirting with $2,100.


Gold has been on an upward trajectory, flirting with the significant threshold of $2,100 after breaking through resistance at $2,062. This surge marks the end of a consolidation phase that persisted through December, hinting at a potential bullish momentum in the precious metal market. The breach of the key resistance level of $2,100 is anticipated to propel gold prices even higher

Source: Bullion Vault


Chart #10 — 

Bitcoin surges above $60k, the highest in 2-years.

Bitcoin's remarkable ascent continued in February, surpassing $62,000 and marking its strongest month since 2020. Notably, Bitcoin exchange-traded funds (ETFs) witnessed unprecedented growth, with BlackRock's Bitcoin ETF, $IBIT, amassing a record $10 billion in assets under management in just 37 days. Institutional adoption remained robust, as evidenced by Morgan Stanley's filing of Bitcoin ETFs. However, amidst this surge, Bitcoin remains highly volatility as underscored by a glitch on Coinbase that resulted in a temporary market cap loss of $100 billion in just 15 minutes. The Bitcoin supply-demand squeeze continues, with daily bitcoin purchase by ETFs is 10x higher than new Bitcoin produced by miners.

Source: Bloomberg


Disclaimer

This marketing document has been issued by Bank Syz Ltd. It is not intended for distribution to, publication, provision or use by individuals or legal entities that are citizens of or reside in a state, country or jurisdiction in which applicable laws and regulations prohibit its distribution, publication, provision or use. It is not directed to any person or entity to whom it would be illegal to send such marketing material. This document is intended for informational purposes only and should not be construed as an offer, solicitation or recommendation for the subscription, purchase, sale or safekeeping of any security or financial instrument or for the engagement in any other transaction, as the provision of any investment advice or service, or as a contractual document. Nothing in this document constitutes an investment, legal, tax or accounting advice or a representation that any investment or strategy is suitable or appropriate for an investor's particular and individual circumstances, nor does it constitute a personalized investment advice for any investor. This document reflects the information, opinions and comments of Bank Syz Ltd. as of the date of its publication, which are subject to change without notice. The opinions and comments of the authors in this document reflect their current views and may not coincide with those of other Syz Group entities or third parties, which may have reached different conclusions. The market valuations, terms and calculations contained herein are estimates only. The information provided comes from sources deemed reliable, but Bank Syz Ltd. does not guarantee its completeness, accuracy, reliability and actuality. Past performance gives no indication of nor guarantees current or future results. Bank Syz Ltd. accepts no liability for any loss arising from the use of this document.

Read More

Straight from the Desk

Syz the moment

Live feeds, charts, breaking stories, all day long.

Thinking out loud

Sign up for our weekly email highlighting the most popular posts.

Follow us

Thinking out loud

Investing with intelligence

Our latest research, commentary and market outlooks