Charles-Henry Monchau

Chief Investment Officer

Chart #1 — 

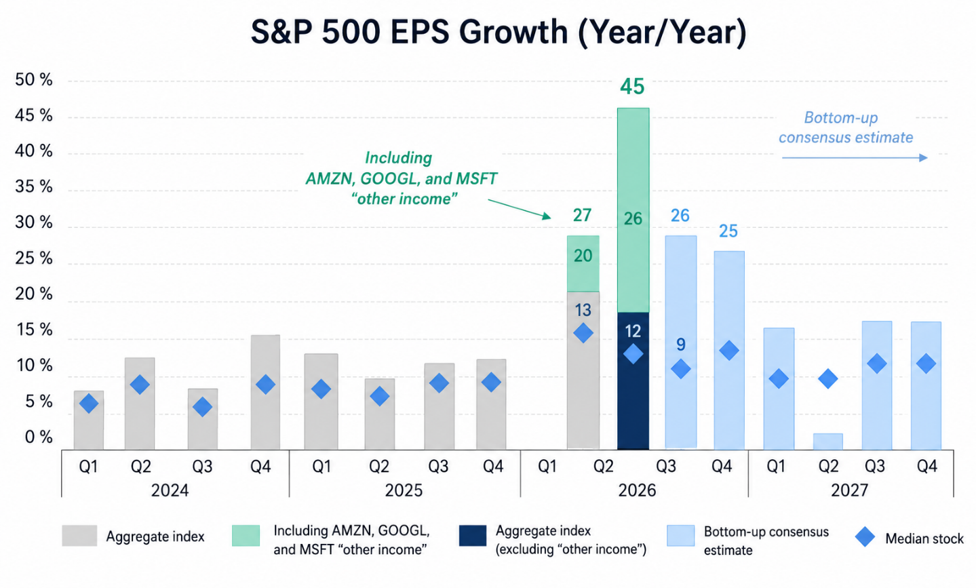
Half of the S&P's "record" earnings growth is just "Big Tech" marking up its own stock portfolio

According to Goldman Sachs strategist Ioannis Blekos, S&P 500 earnings-per-share growth is actually running closer to 26% year-on-year, once you strip out the "other income" mega-cap tech books from the appreciation of its own equity stakes. The headline figure including those gains is 45%.

In other words, this "record" earnings season we keep hearing about only hits 45% because Nvidia and its peers are booking the paper gains on their own investment bets as profit.

Excluding that accounting effect, Big Tech marking its own venture stakes to market, the number collapses by nearly half, to 26%.


Source: Goldman Sachs, zerohedge  


Chart #2 — 

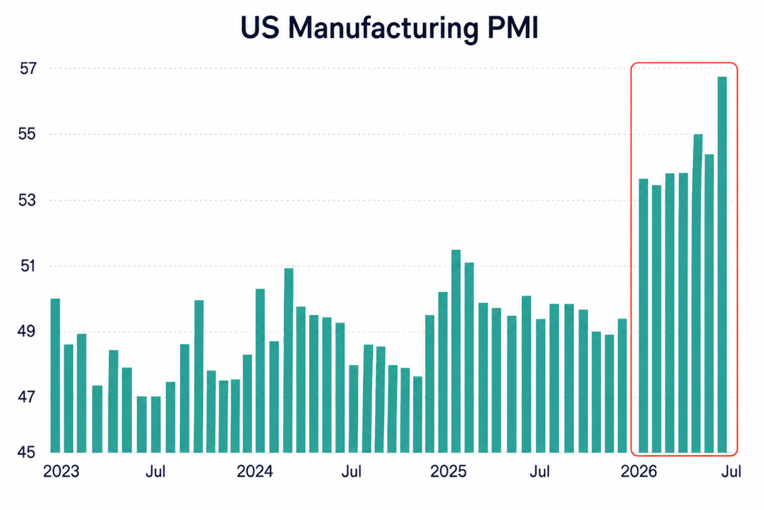
The US economy just entered the phase that produced the biggest rallies in stocks

The ISM Manufacturing PMI came in at 55.6 for July, against the 54.0 expectations. It is the seventh straight month the index has sat in expansion territory, and is now at its peak in 4 years, a run that marks a sharp break from the pattern of 2022 to 2025.

Why manufacturing strength shows up in the markets? Manufacturing strength tends to show up in financial markets before it spreads through to the rest of the economy. As orders pick up at factories, the effect ripples outward to component suppliers, logistics firms, equipment providers, and the broader web of businesses that service them. Higher output lifts revenue, supports hiring, and widens profit margins across that chain.

That cash doesn't just sit on balance sheets. Companies plow it back into capacity, add workers, and, over time, some of it flows into financial markets. It's why a sustained manufacturing upswing has historically coincided with a favourable environment for risk assets.

The trend isn't confined to the US. Japan posted its own strong reading Friday, with manufacturing PMI climbing to 54.5, a seventh consecutive month of expansion there too, and the fastest pace of factory output growth since 2014.

With two of the world's largest manufacturing economies accelerating at the same time, the global industrial cycle looks to be gaining momentum.

Source: Institute for Supply Management (ISM)


Chart #3 — 

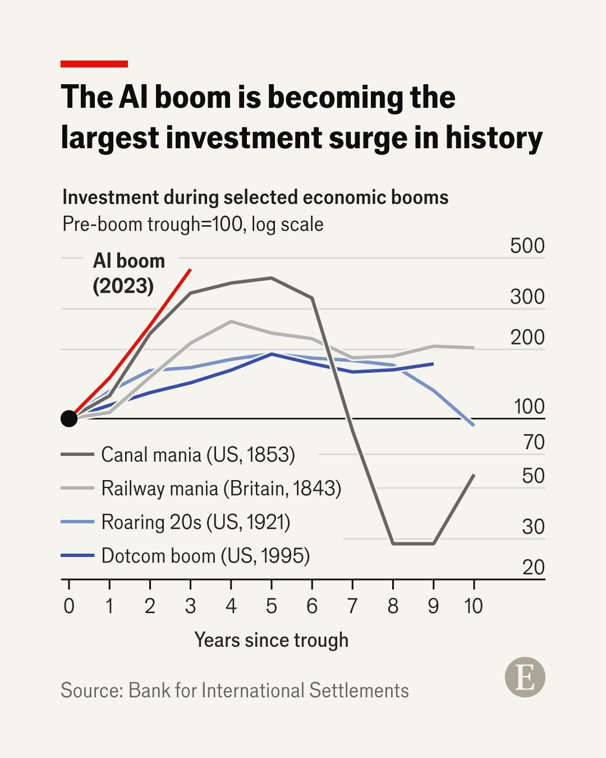
The AI boom is becoming the largest investment surge in history

This chart shows capital spending on AI is on pace to become the largest investment surge in history, comparable with various previous economic booms such as Britain’s 19th century railway mania and America’s dotcom bubble.

The scale of the bet yet doesn’t guarantee that the returns will follow.

Source: The Economist  


Chart #4 — 

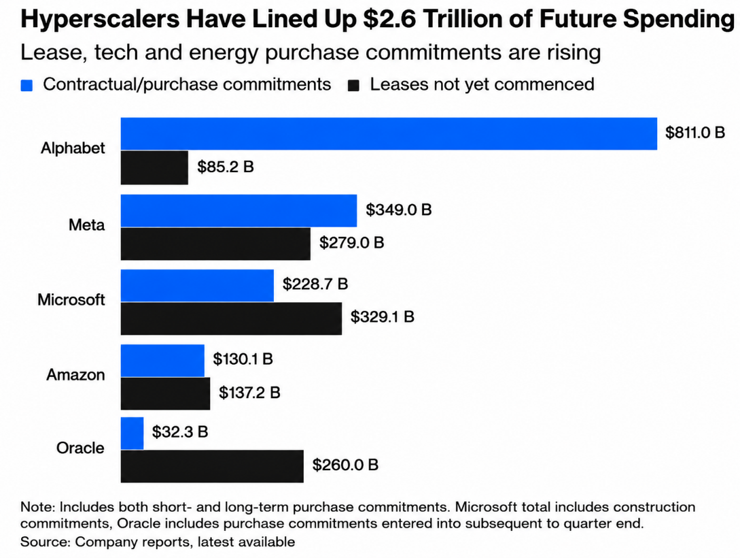
The scariest number in the AI boom is the one that never shows up on a balance sheet

The five biggest hyperscalers have now committed more than $2.6tn to data centres, chips, and power infrastructure. Alphabet alone owes $811bn, the bulk of it hidden in footnotes.

That money is owed whether or not AI demand shows up as promised. And the market is already starting to price in the risk: the cost of insuring these companies' debt has begun climbing. Credit markets tend to smell trouble before anyone else does.

If the spending outpaces the revenue it's supposed to generate, the first sign of stress won't come from earnings calls, but will appear in the bond prices of the world's biggest companies. 


Source: Bloomberg


Chart #5 — 

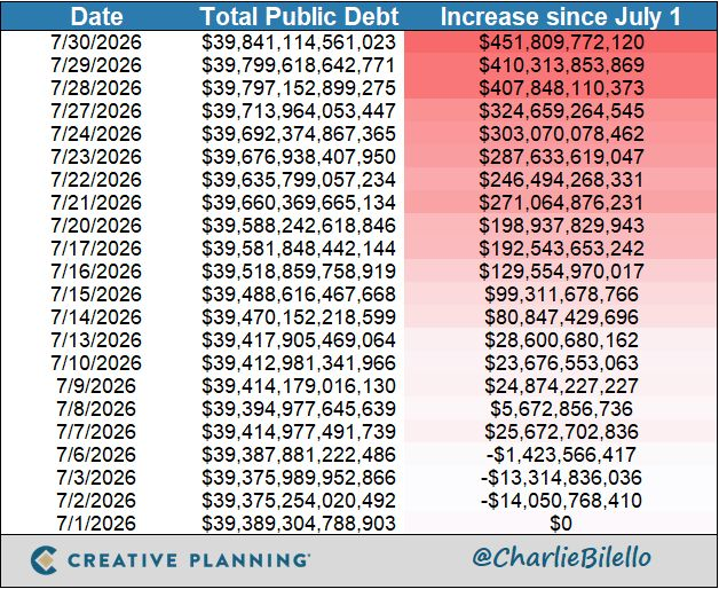
The US has added $450bn to the national debt since 1 July


That’s more than $15bn a day.

“There are two ways to enslave a country. One is by the sword. The other is by debt.” – John Adams


Source: Peter Mallouk


Chart #6 —

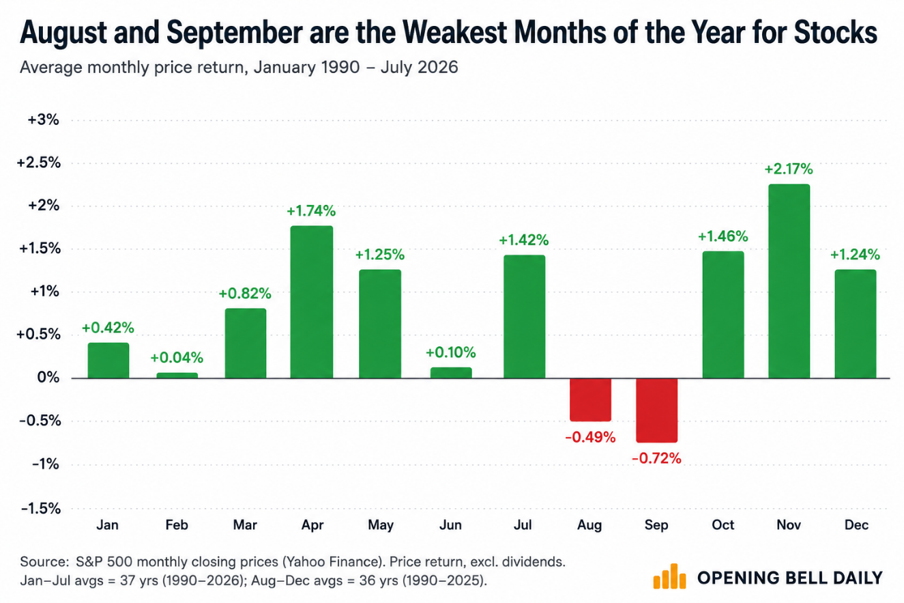
The S&P 500 just entered its weakest stretch of the year historically

Monthly returns since 1990:

August: -0.49%

September: -0.72%

That being said, buying the dip has paid off for decades, thanks to a strong Q4 rebound on average.


Source: Opening Bell Daily


Chart #7 — 

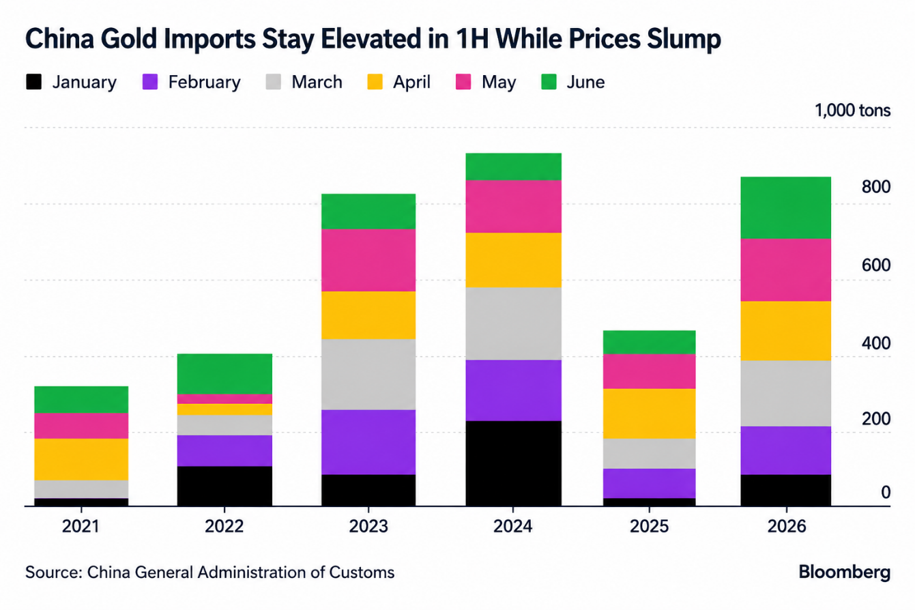
China's gold buying is reaching extraordinary levels

China imported more gold in June than what the world's ten biggest gold-mining countries combined can produce in a month. Spread across a full year, that pace would amount to roughly 60% of all the gold mined on Earth.

This isn't the first time Beijing has moved this aggressively to build up reserves. Right after the Iran conflict began, China bought crude oil at record volumes, taking advantage of the uncertainty. Now gold is getting the same treatment.

Is this about moving away from the dollar? Getting ready for a more divided global financial system? Or just building up reserves more broadly? Whatever the reason, the size of these purchases is hard to ignore.

The question isn't whether China is stockpiling anymore, but what it is stockpiling for.


Source: Bloomberg


Disclaimer

This marketing document has been issued by Bank Syz Ltd. It is not intended for distribution to, publication, provision or use by individuals or legal entities that are citizens of or reside in a state, country or jurisdiction in which applicable laws and regulations prohibit its distribution, publication, provision or use. It is not directed to any person or entity to whom it would be illegal to send such marketing material. This document is intended for informational purposes only and should not be construed as an offer, solicitation or recommendation for the subscription, purchase, sale or safekeeping of any security or financial instrument or for the engagement in any other transaction, as the provision of any investment advice or service, or as a contractual document. Nothing in this document constitutes an investment, legal, tax or accounting advice or a representation that any investment or strategy is suitable or appropriate for an investor's particular and individual circumstances, nor does it constitute a personalized investment advice for any investor. This document reflects the information, opinions and comments of Bank Syz Ltd. as of the date of its publication, which are subject to change without notice. The opinions and comments of the authors in this document reflect their current views and may not coincide with those of other Syz Group entities or third parties, which may have reached different conclusions. The market valuations, terms and calculations contained herein are estimates only. The information provided comes from sources deemed reliable, but Bank Syz Ltd. does not guarantee its completeness, accuracy, reliability and actuality. Past performance gives no indication of nor guarantees current or future results. Bank Syz Ltd. accepts no liability for any loss arising from the use of this document.

Read More

Straight from the Desk

Syz the moment

Live feeds, charts, breaking stories, all day long.

Thinking out loud

Sign up for our weekly email highlighting the most popular posts.

Follow us

Thinking out loud

Investing with intelligence

Our latest research, commentary and market outlooks