
Charles-Henry Monchau, CFA, CMT, CAIA

Chief Investment Officer

Chart #1 — 

Wall Street suffers its heaviest one-session loss of value on record

Thursday, 5 November, ranked among the roughest trading days of the year for American stocks. The S&P 500 slid 4.4% and finished at 7,354. The Nasdaq 100 shed about 6.4%, and the Philadelphia Semiconductor Index (SOX) plunged 12.3%, leaving chipmakers close to 38% under their June high. The weakness was not confined to a handful of companies: falling stocks outnumbered rising ones by more than five to one, and 84% of the day's turnover occurred in names that were losing ground.

Roughly $2.8tn of market value vanished in a single day. That is the largest daily destruction of value ever measured, topping the earlier high of about $2.69tn reached during the pandemic-driven sell-off.

Politics lit the fuse. Wednesday's post-election bounce had been fuelled by relief that the vote was behind us and by hopes of a split Congress, yet it faded within 24 hours. Participants turned to the implications of a stronger Democratic showing, especially in state capitals, for the AI build-out. Their worries are practical: power and water demand, planning approvals, and the climbing price of constructing data centres. A weak earnings outlook from Qualcomm further weighed on the chip sector.

Source: Litest; heatmap format: TradingView
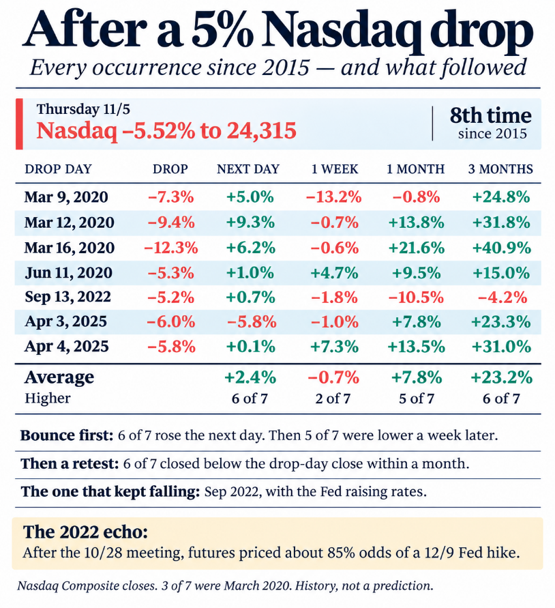

Chart #2 — 

How has the Nasdaq behaved after earlier falls of 5%?

The Nasdaq Composite's 5.52% drop on Thursday is its eighth fall of more than 5% since 2015. Looking back at the seven earlier cases:

  • On the following session, 6 of the 7 bounced.

  • Seven days on, 5 of the 7 stood lower.

  • Three months on, 6 of the 7 were higher, gaining 23% on average.

The dataset is thin, and three of the seven cases come from March 2020. Still, it illustrates that a first bounce does not guarantee the sell-off has run its course. Historical patterns offer no assurance about what happens next.

Source: Donald Dean (X), using Nasdaq Composite closing prices
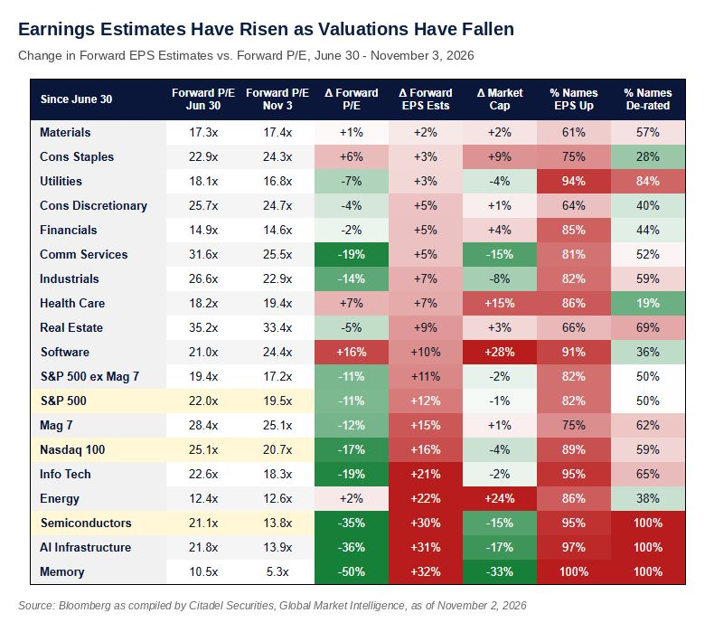


Chart #3 — 

Share prices are sliding even though profit forecasts keep rising

The faster analysts lifted their forecasts, the more valuations shrank. Since 30 June, expected earnings per share (EPS) over the coming twelve months have climbed 32% for memory makers, 31% for AI infrastructure companies and 30% for semiconductors overall. Over that same stretch, the forward price-to-earnings (P/E) ratios of those groups dropped 50%, 36% and 35%, in that order. Every one of the 20 chip companies in the S&P 500 now trades on a lower multiple.

Source: Zero Hedge, Citadel Securities
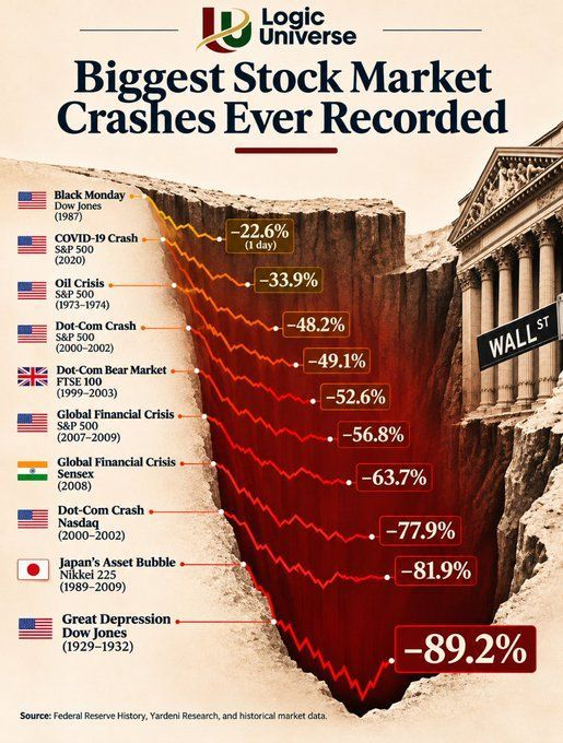

Chart #4 — 

The deepest equity market collapses on record

A graphic ranking the most severe stock market crashes in history, which helps put Thursday's drop into perspective.

Source: Logic Universe


Chart #5 — 

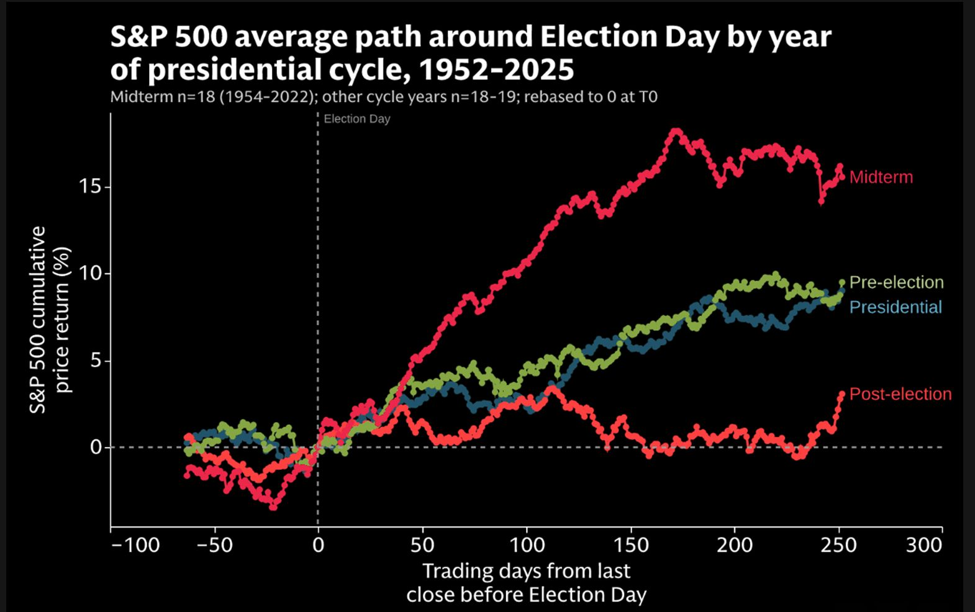
Might the midterm elections give US stocks a lift?

Market Intelligence, J.P. Morgan’s research group, argues that past patterns point to a supportive effect from US midterm elections on share prices. Dating back to 1990, the S&P 500 has returned an average of 5.4% after three months, 11.4% after six, 12.5% after nine and 14.7% after twelve. At the six, nine and twelve-month marks, the index has never ended lower.

The bank adds that the latest round of risk reduction falls short of a full capitulation, with systematic selling and crowded technology positions still looming as threats. Even so, heavy deleveraging and a momentum exposure that has sunk to only 30% of its high suggest conditions could be ripe for an alpha recovery.


Source: J.P. Morgan, TME


Chart #6 —

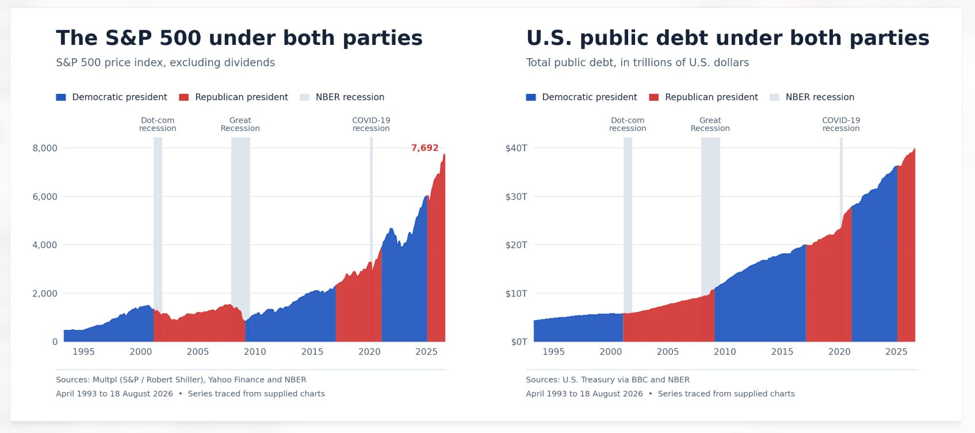
Regardless of who governs, equities and government debt tend to climb over time

Across several decades, both the S&P 500 and US federal debt have moved upward under presidents from each party. Public borrowing looks set to carry on, and nominal economic growth should stay robust enough to support share prices. Judging by the record, the broad outcome has been much the same whichever party occupies the White House.

Source: Multpl (S&P / Robert Shiller), Yahoo Finance, U.S. Treasury via BBC, NBER


Chart #7 — 

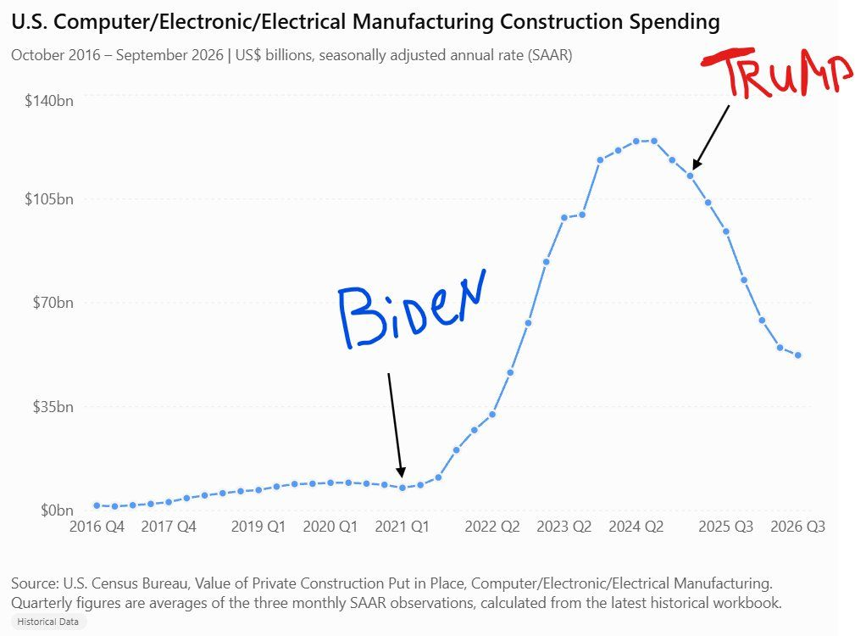
The AI and data centre investment wave shows no sign of fading

Those predicting a crash in American data centre outlays after the Democratic advance tend to forget that the CHIPS Act, signed during Joe Biden's presidency, rebuilt the country's chipmaking base. That same administration also set off a race for computing power against China by imposing sweeping export restrictions on cutting-edge chip-making tools.

Artificial intelligence and data centres are now treated as questions of national security and economic strength. We therefore see no reason for this investment cycle to wind down in the near term.


Source: U.S. Census Bureau (Value of Private Construction Put in Place), via Monolith_Cap


Disclaimer

This marketing document has been issued by Bank Syz Ltd. It is not intended for distribution to, publication, provision or use by individuals or legal entities that are citizens of or reside in a state, country or jurisdiction in which applicable laws and regulations prohibit its distribution, publication, provision or use. It is not directed to any person or entity to whom it would be illegal to send such marketing material. This document is intended for informational purposes only and should not be construed as an offer, solicitation or recommendation for the subscription, purchase, sale or safekeeping of any security or financial instrument or for the engagement in any other transaction, as the provision of any investment advice or service, or as a contractual document. Nothing in this document constitutes an investment, legal, tax or accounting advice or a representation that any investment or strategy is suitable or appropriate for an investor's particular and individual circumstances, nor does it constitute a personalized investment advice for any investor. This document reflects the information, opinions and comments of Bank Syz Ltd. as of the date of its publication, which are subject to change without notice. The opinions and comments of the authors in this document reflect their current views and may not coincide with those of other Syz Group entities or third parties, which may have reached different conclusions. The market valuations, terms and calculations contained herein are estimates only. The information provided comes from sources deemed reliable, but Bank Syz Ltd. does not guarantee its completeness, accuracy, reliability and actuality. Past performance gives no indication of nor guarantees current or future results. Bank Syz Ltd. accepts no liability for any loss arising from the use of this document.

Read More

Straight from the Desk

Syz the moment

Live feeds, charts, breaking stories, all day long.

Thinking out loud

Sign up for our weekly email highlighting the most popular posts.

Follow us

Thinking out loud

Investing with intelligence

Our latest research, commentary and market outlooks