Charles-Henry Monchau

Chief Investment Officer

Chart #1 — 

The Fed cut rates as expected and initiate purchases of short-term US Treasuries

In its December meeting, the US central bank (Federal Reserve) decided to cut its key rate by 0.25 percentage points to the range of 3.50% to 3.75%. In addition, it stopped its quantitative tightening programme (i.e., the reduction of its balance sheet) on 1 December and decided to initiate purchases of shorter-term Treasury securities as “needed to maintain an ample supply of reserves on an ongoing basis”.

By cutting its key rate a third time in a row and announcing to assign purchases of shorter-term Treasury securities, the Fed finally met all market expectations. The Christmas present was given in form of Powell's “dovish touch” at the press conference, arguing to aim for a strong economy, although he also indicated that the key rate got now close to a “plausible estimate of a neutral rate”, bringing the Fed into a situation where it can afford to “wait and see”.

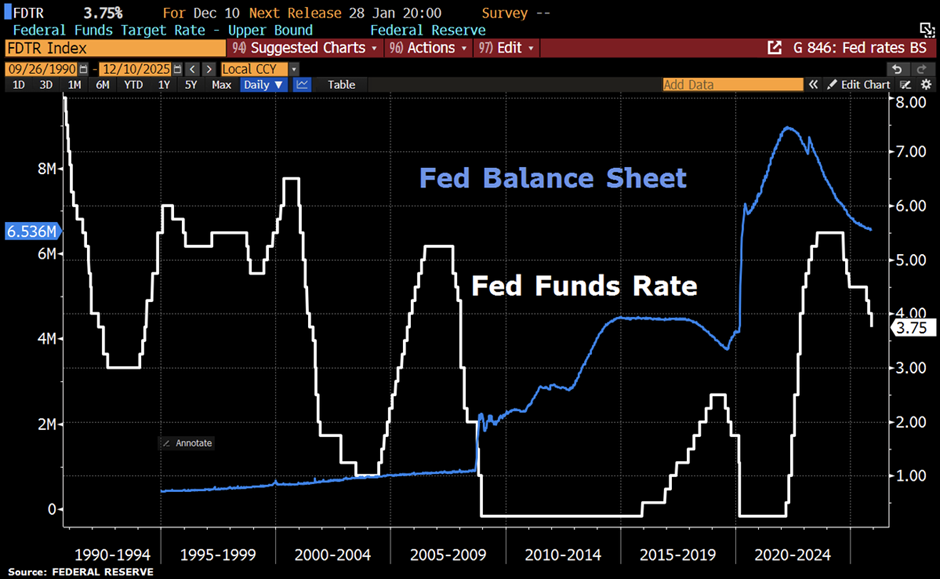
Source: HolgerZ, Bloomberg


Chart #2 — 

Inflation at zero, Swiss National Bank (SNB) rates at zero

As expected, the SNB left its key interest rate at 0.0% and justified its decision by stating that the disappointingly low inflation in November and the recent contraction of the Swiss economy in the third quarter are temporary in nature, an assessment we share.

In this context, the SNB also pointed out that the global economic outlook has brightened, which should help the Swiss economy over the next few quarters. The National Bank also expects the Swiss economy to benefit from lower import tariffs in the US. We share this outlook and also expect economic growth in Switzerland, as well as at European and global level, to improve in the coming quarters.

Interestingly, the SNB is forecasting significantly lower inflation for the coming months than in its September outlook. The fact that the National Bank is nevertheless leaving interest rates at 0% is further evidence that the hurdle for a move below zero remains high.

Source: Syz Bank, Factset


Chart #3 — 

Oracle quarterly results disappoint as debt hit $127bn


Oracle shares dropped sharply on Thursday after the company reported a revenue miss and lifted its spending outlook, reigniting concerns over its leverage.

The cloud and database software group posted quarterly revenue of $16.06 bn, slightly below the $16.21 bn consensus, according to LSEG, despite strong demand for AI infrastructure. The miss has added to doubts about how quickly large tech players can monetise heavy AI investment.

The balance sheet only amplifies those concerns. Oracle carries roughly $127 bn of debt, with $25 bn maturing within three years. Free cash flow is deeply negative—around –$13 bn over the past 12 months—and the company is not expected to turn FCF-positive before 2028.

Source: Patient Investor @patientinvestt


Chart #4 — 

Oracle’s bet on OpenAI

Oracle’s AI strategy comes with extreme customer concentration risk. More than 50% of its contract backlog is tied to a single client, whose future commitments require heavy upfront capital spending. At the same time, the AI infrastructure boom is creating very different risk profiles across hyperscalers.

Peers are largely funding AI buildouts through strong operating cash flow or manageable leverage. Oracle is the outlier: customer concentration is rising just as free cash flow has turned negative. Structurally, this is not a broad-based AI upside story but a clear ‘barbell’ outcome. Upside is highly dependent on the success and scale-up of one major client, notably OpenAI, while downside risk sits squarely on Oracle’s balance sheet if that growth trajectory disappoints.

In short, Oracle is taking materially higher, asymmetric risk than other AI infrastructure vendors as the market moves into the next phase of deployment. This setup warrants caution.

Source: FT


Chart #5 — 

Why silver is having its best year in 45 years

Silver hit a record high last week and is up roughly +110% in 2025, marking its second-best year on record. This move is not speculative noise. It reflects a physically tight market colliding with powerful macro and demand tailwinds:

  • China supply collapse: SHFE inventories are at a 9-year low, with heavy exports draining global bullion hubs.
  • London liquidity stress: despite record inflows, available metal remains scarce and borrowing costs stay elevated, signalling real physical tightness.
  • American tariff fears: anticipation of potential US tariffs has pulled large volumes of silver into the US, further squeezing the London market.
  • India’s demand surge: accelerating buying from one of the world’s largest silver consumers is intensifying the supply squeeze.
  • Retail pile-in: silver ETFs are heading toward a 10th consecutive month of inflows, while call option activity on the largest silver ETF is spiking.
  • Fed rate-cut bets: falling real rates boost the appeal of non-yielding assets like silver relative to cash and bonds.
  • Solar demand boom: photovoltaic installations are accelerating into peak season, consuming physical silver at an unusually rapid pace.
  • China tax arbitrage: changes to gold taxation have pushed domestic investors toward silver, adding another layer of demand.

Source: Global Markets Investor, David Ingles, Bloomberg


Chart #6 —

Watch the gold-to-silver ratio

The gold-to-silver ratio is beginning to move sharply, a pattern often observed after it reaches extremely elevated levels.

Source:  Tavi Costa, Bloomberg 


Chart #7 — 

Will Santa be coming to town this year? 

The last five trading days of the year, plus the first two trading days of the new year, are known as the “Santa Claus rally”.

Since 1980, this period has delivered positive returns 73% of the time, with an average S&P 500 gain of 1.1%.

Merry Christmas!


Source: Edward Jones via Markets & Mayhem  


Disclaimer

This marketing document has been issued by Bank Syz Ltd. It is not intended for distribution to, publication, provision or use by individuals or legal entities that are citizens of or reside in a state, country or jurisdiction in which applicable laws and regulations prohibit its distribution, publication, provision or use. It is not directed to any person or entity to whom it would be illegal to send such marketing material. This document is intended for informational purposes only and should not be construed as an offer, solicitation or recommendation for the subscription, purchase, sale or safekeeping of any security or financial instrument or for the engagement in any other transaction, as the provision of any investment advice or service, or as a contractual document. Nothing in this document constitutes an investment, legal, tax or accounting advice or a representation that any investment or strategy is suitable or appropriate for an investor's particular and individual circumstances, nor does it constitute a personalized investment advice for any investor. This document reflects the information, opinions and comments of Bank Syz Ltd. as of the date of its publication, which are subject to change without notice. The opinions and comments of the authors in this document reflect their current views and may not coincide with those of other Syz Group entities or third parties, which may have reached different conclusions. The market valuations, terms and calculations contained herein are estimates only. The information provided comes from sources deemed reliable, but Bank Syz Ltd. does not guarantee its completeness, accuracy, reliability and actuality. Past performance gives no indication of nor guarantees current or future results. Bank Syz Ltd. accepts no liability for any loss arising from the use of this document.

Read More

Straight from the Desk

Syz the moment

Live feeds, charts, breaking stories, all day long.

Thinking out loud

Sign up for our weekly email highlighting the most popular posts.

Follow us

Thinking out loud

Investing with intelligence

Our latest research, commentary and market outlooks