S&P 500 performance is driven by only a few stocks
As we all know, the sunken part of an iceberg can be very different from what is visible on the surface. This allegory seems particularly apt for what we have seen in the U.S. equity markets since the beginning of 2023.
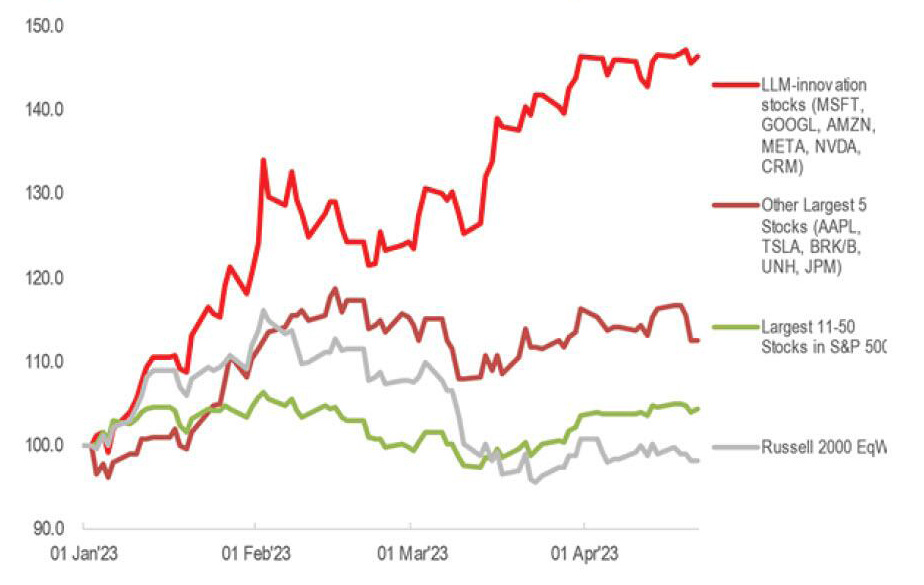
While the S&P 500 and Nasdaq indices have performed remarkably well since the beginning of the year (8% and 17% respectively), only a very limited number of stocks have contributed to the indices' advance.
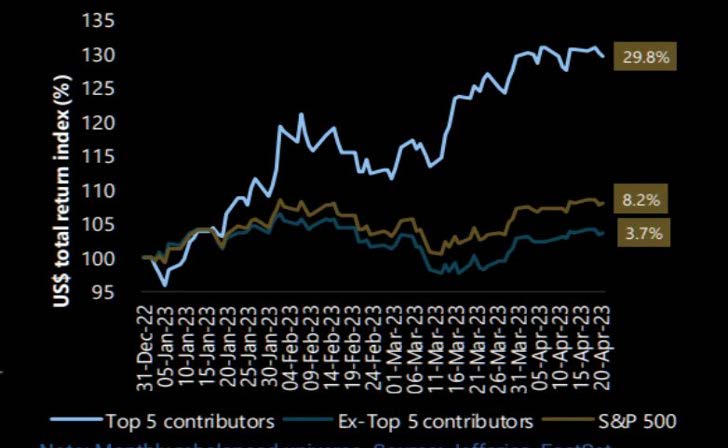
Indeed, the 10 largest market capitalizations are responsible for 86% of the overall performance of the S&P 500 Index since the beginning of the year. As shown in the chart below, an index made up of the 5 largest market capitalizations (Apple, Microsoft, Amazon, Nvidia and Google/Alphabet) is up +29.8% since the beginning of the year. The index made up of the other 495 stocks in the S&P 500 is up "only" 3.7% over the same period.
Performance of the 5 largest contributors to the S&P 500, the S&P 500 Index and the index that represents the remaining 495 stocks
Source: TME, Jefferies, Factset
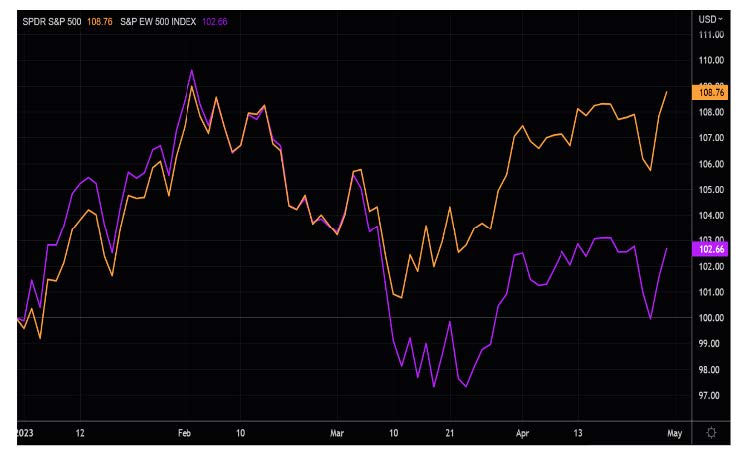
The performance gap between the S&P 500 and the S&P 500 Equal Weight - i.e. an index where each component has the same weight - has been relatively large since the beginning of the year (over 600 basis points difference).
Performance of the S&P 500 Index vs. the S&P 500 Equal Weight Index
Source: TME, Refinitiv
A more precise calculation shows that two stocks alone - Apple and Microsoft - are responsible for half of the index's increase. It should also be noted that the major U.S. indices have rarely been so concentrated on a few stocks. Indeed, the two stocks mentioned above represent 13.4% of the S&P 500 index. The ten largest capitalizations represent
28.7% of the S&P 500, a percentage slightly below the highs observed during the GAFAs bubble in 2020-2021, but well above the dot-coms bubble in 2000-2001.


.png)
