


.png)
On Monday, bitcoin broke above USD 85,000 for the first time in eight months. The move came despite a backdrop that would normally weigh on risk assets: the ten-year Treasury yield had risen above 5%, the CLARITY Act had stalled in the Senate, and the Federal Reserve delivered its first rate hike since 2023. Yet rather than retreat, bitcoin has rallied 30% from its August low.
The easy conclusion is that the “crypto winter” is over. But the more interesting question is why an asset that behaved like a leveraged Nasdaq position for three years is now behaving more like gold One explanation is that bitcoin has never been a single asset class. It has evolved through three distinct phases, each with a different set of drivers, and may now be entering a fourth.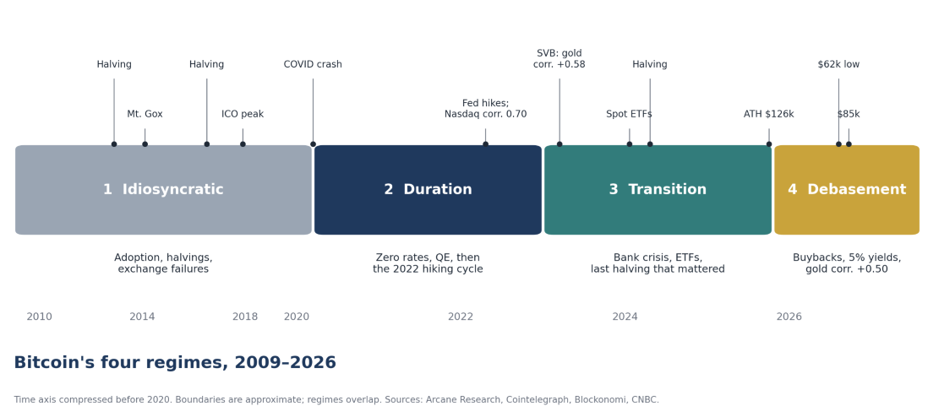
Bitcoin's four regimes, with the events that marked each boundary. Time axis compressed before 2020.
The break came in March 2020. In the COVID-19 liquidation, bitcoin fell by half in two days alongside other risk assets, then rallied on zero rates, quantitative easing and fiscal stimulus. From that point its correlation with the S&P 500 and the Nasdaq rose to around 50%, unprecedented for the asset. “Digital gold” was the narrative, but its market behaviour increasingly resembled high-beta Nasdaq exposure. Bitcoin was being priced as what it economically is: a zero-cash-flow asset whose entire value sits in the distant future, making it highly sensitive to changes in the discount rate.
The regime was tested in 2022 and passed. As the Fed began hiking, bitcoin's 30-day correlation with the Nasdaq reached 0.70, its highest level since 2020, while its correlation with gold fell to –0.45, near an all-time low. This happened with US inflation at 8.5%, the highest level since the early 1980s. If bitcoin were an inflation hedge, 2022 was the year to prove it. Instead, it fell more than 75% from its peak, in lockstep with technology stocks. The collapses of Terra, Three Arrows and FTX amplified the decline, but they were amplifiers of a macro trade, not the trade itself.
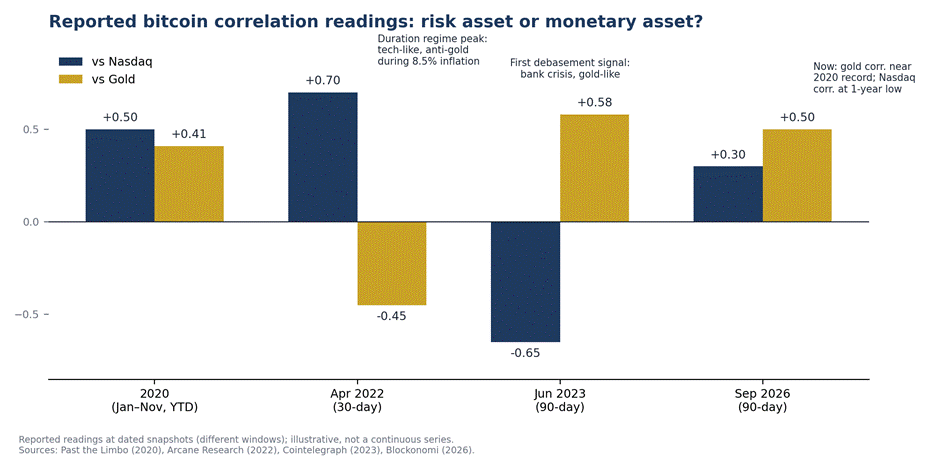
Reported correlation readings at four dated snapshots. The 2022 reading is the signature of the duration regime; 2023 and 2026 are the debasement signal.
The duration model first failed in March 2023. After Silvergate, Signature and Silicon Valley Bank collapsed, bitcoin and gold rallied together. By June, the 90-day correlation was +0.58 with gold and –0.65 with technology stocks. For the first time, bitcoin behaved more like a hedge against the banking system rather than a bet on the discount rate. The effect did not last. The reading faded within months, and the spot ETFs launched in January 2024 brought in a new class of allocators trading bitcoin as a liquid risk asset alongside the AI trade. For most of 2024 and 2025, the two models alternated: risk-on with the Nasdaq when AI led, and a debasement bid during tariff and deficit scares.
What replaced the halving
Something else happened in that transition that is easy to miss: bitcoin's internal drivers didn’t disappear, they changed form. The halving's arithmetic has decayed to irrelevance. In 2011, new supply amounted to 49% of coins outstanding. By 2017, it was 4%; following the April 2024 halving, it had fallen to 0.8% a year, below the 1.5–2% added by the gold miners annually. The 2012 halving removed roughly 1.3 million coins a year of sell pressure from a market worth a few hundred million dollars, while the 2024 halving removed 164,000 from a market worth over a trillion. Three of the four cycles were real. The fourth phase — the 2024–25 rally — was driven more by ETFs and macro factors than by the halving itself. With 96% of all bitcoin already mined, the 2028 halving is likely to have a much smaller impact on the supply outlook. Halvings set the supply. ETFs transmit the macro. Treasury companies add the leverage.
Two new internal clocks took the halving's place. The first is the ETF flow clock. BlackRock's IBIT alone holds about 730,000 bitcoin and the US spot ETFs combined well over 1.2 million — roughly seven years of current issuance — and their daily creations and redemptions are now the marginal price-setter in dollar terms. The ETFs did not create bitcoin's macro sensitivity, but they made it more pronounced and more immediate, because they brought in allocators who buy during macro relief and sell during macro stress. The past fortnight shows the mechanism: USD 463 million out in the four days after the Fed hike, USD 433 million in on the following Friday.
The second is the leverage clock, invented by Strategy, formerly MicroStrategy, and adopted by roughly 200 listed companies. Strategy financed the purchase of 845,000 bitcoin, worth about USD 66 billion, by issuing equity, convertible securities and several series of preferred stock. The engine is the premium of its market value to the value of its coins. Above one times net asset value, the company can sell stock at a premium, buy bitcoin at spot, increase bitcoin per share and widen the premium: a flywheel that made treasury companies the largest marginal buyers of 2024–25. Strategy's premium was 3.4 times in November 2024. By August 2026, it had fallen to 0.68 times. Below one, the flywheel reverses: new issuance becomes dilutive and stops, the preferred dividends remain due, the equity falls faster than bitcoin because fixed claims leave common shareholders absorbing the full variation in the underlying asset. The discount can then deepen. This is why the 2026 drawdown had the same anatomy as 2022: a leverage unwind amplifying a macro move, except that this time the leverage sat inside regulated equity markets rather than offshore lenders.
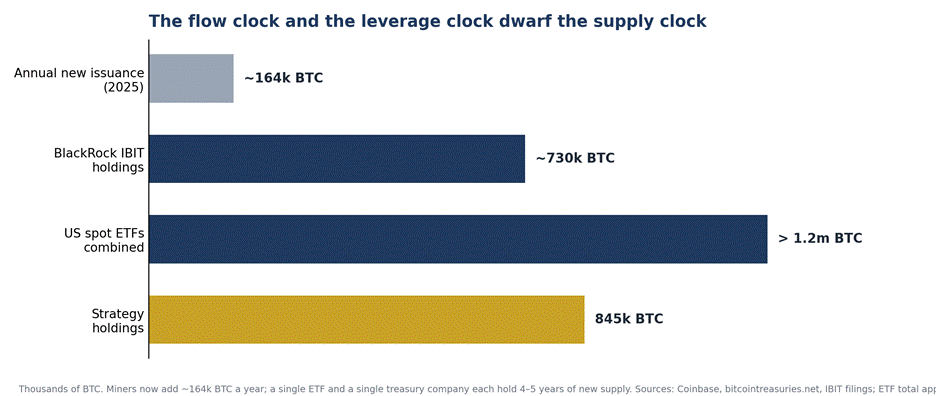
Annual issuance against the holdings of a single ETF and a single treasury company. The supply clock is now the smallest of the three.
The fall from USD 126,000 last October to about USD 62,000 in August was, in other words, a 2022-style event: rising real yields, a Fed turning hawkish, and a leverage unwind. What is new is the recovery. Bitcoin's 90-day correlation with gold has more than doubled this year to about +0.50, close to the 2020 record, while its correlation with the Nasdaq has fallen to roughly 0.30, a one-year low. The turn can be dated. It followed the Treasury's decision in August to double its buybacks of long-dated debt to relieve the long end of the curve, then came the week of 15–21 September.
The distinction matters. Phase two was about the price of money: bitcoin rose and fell with the discount rate. Phase four is about the credibility of money: yields rising because the Treasury must intervene in its own market, inflation driven by oil rather than demand, and a central bank hiking into a fiscal problem. That is the classic set-up for gold, and gold sits at record levels. Bitcoin is now trading on it. An asset that makes an eight-month high through a rate hike no longer behaving purely as a duration asset — or, at least, duration is no longer the only driver.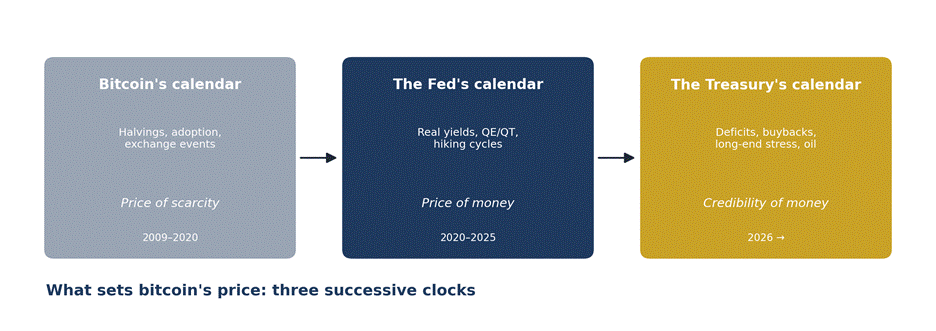
Three successive clocks. Phase two was about the price of money; phase four is about its credibility.