.png)
A week of contradictions from Washington
The past seven days offered a striking illustration of the strategic incoherence — or perhaps deliberate ambiguity — that has characterised US policy toward Iran since the conflict began. In the space of a single week, the United States simultaneously bombed Iranian targets and issued a Treasury waiver on 140 million barrels of Iranian crude sitting on tankers. The idea was to allow non-Chinese buyers to bid on that oil, theoretically relieving pressure on physical markets. Iran's response was swift and dismissive: its Oil Ministry confirmed that zero barrels of Iranian crude remain on the water, describing the waiver as a form of 'psychological control over the market.' There is, in other words, no oil coming. The licence is a signal, not a solution.
At the same moment, Trump was simultaneously suggesting he was 'considering winding down' military efforts and contemplating a ground operation. The Pentagon was requesting USD $200bn from Congress to fund the war, while the White House was calling NATO allies cowards for not helping reopen the Strait of Hormuz. The war is costing approximately $1bn per day. Trump's argument that the US has no stake in Hormuz because it does not use the strait placed enormous diplomatic pressure on Europe, Japan, South Korea, and China — all of whom depend on the waterway for between 20% and 90% of their oil imports — while simultaneously making clear that Washington has little appetite to solve a problem of its own making.
"Sometimes you have to escalate to de-escalate. This is the only language the Iranians understand." — Treasury Secretary Scott Bessent
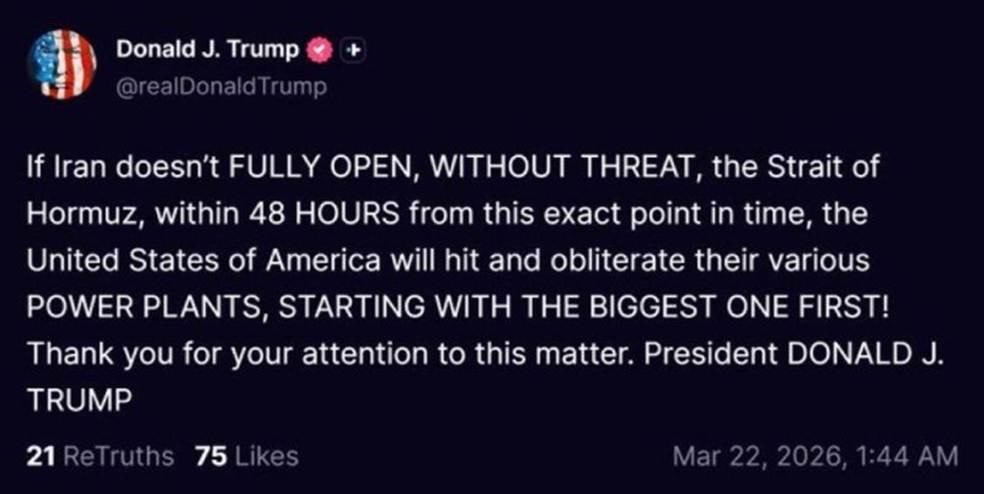
That framing encapsulates the week's defining tension. On Sunday, Treasury Secretary Bessent attempted to reconcile Trump's apparently contradictory signals on NBC's Meet the Press, arguing that escalation and de-escalation are not mutually exclusive. The US, he suggested, may need to intensify its military campaign in order to create the conditions for ending it. Within days, Trump issued a 48-hour ultimatum threatening to destroy Iran's power grid and largest nuclear power facility if the Strait was not fully reopened. The threat represented a significant policy shift: just days earlier, the US had publicly committed to avoiding civilian infrastructure. Threatening nationwide blackouts for 90 million people is a different doctrine entirely.
The military and geographical realities
There is, however, a practical problem with the ultimatum that analysts were quick to identify. Iran is not a country that is easy to incapacitate from the air. Shielded to the west by the Zagros Mountains and to the north by the Alborz range with vast deserts between, the country's geography has historically defeated would-be invaders. Its most sensitive military and nuclear infrastructure is buried deep in the mountains — and nearly 900 airstrikes have thus far failed to neutralise it. The blunt summary, widely circulated among defence analysts: you cannot destroy what you cannot reach.
Meanwhile, the US has deployed 50,000 troops to the region, added three more warships, and deployed approximately 2,500 additional marines, all while publicly contemplating an exit. The contradiction between the military posture and the stated desire to wind down is not lost on markets, which have learned to price geopolitical headline risk in near real-time. On Friday alone, the S&P 500 swung $900bn in market capitalisation across a 90-minute window as Trump's comments shifted from belligerence to restraint and back again.
Iran's horizontal escalation and the GCC threat
Iran, for its part, appears to be pursuing what strategists describe as 'horizontal escalation' — spreading risk across the region rather than absorbing punishment vertically. As Trump threatened the power grid, Iran escalated its own rhetoric by threatening to target desalination plants across Gulf Cooperation Council (GCC) countries. The asymmetry is stark: Iran derives only 2% of its domestic water from desalination. Kuwait depends on desalination for 90% of its freshwater. Saudi Arabia, 70%. The UAE, 42%. A successful strike on Gulf desalination infrastructure would not merely disrupt oil markets; it would threaten the basic habitability of the region's major population centres, drawing in countries that have so far sought to remain outside the conflict. This is the 'regionalisation' risk that most base-case scenarios have not yet fully priced.
The ceasefire proposal
Against this backdrop of escalating threats, reporting by Axios indicated that the United States has quietly delivered a six-point peace proposal to Iran via intermediaries in Egypt, Qatar, and the United Kingdom. The terms are demanding: a five-year suspension of Iran's missile programme; the complete cessation of uranium enrichment; the permanent closure of damaged reactor facilities at Natanz, Isfahan, and Fordow; strict international oversight of all centrifuge operations; regional arms control limiting Iran's missile inventory to a maximum of 1,000; and the termination of all funding to proxy groups including Hezbollah, the Houthis, and Hamas. Notably absent from the list: any demand for regime change. The omission is deliberate and significant — it suggests that the US is seeking a negotiated settlement that the current Iranian government could, in theory, accept and survive politically. Whether Tehran's calculus, under sustained military pressure and economic strain, will move in that direction remains the central unknown.
The bond market as a constraint on war
One factor that may ultimately prove more decisive than military strategy is the state of US public finances. US Treasury debt now stands at $39tr. The Pentagon's $200bn war funding request arrives at a moment when bond yields are rising sharply, the two-year yield has broken above the Fed funds ceiling for the first time since the rate-hiking cycle of 2023, and the deficit trajectory was already under pressure. The bond market has historically served as a constraint on presidential ambition — most vividly during the 1994 Clinton administration, when James Carville famously stated that if he could be reincarnated, he would want to come back as the bond market, because it could intimidate everybody. There is a growing view in financial markets that the bond market may yet serve that function again here, nudging Trump toward an exit that pure military logic would not dictate.
Monday’s turnaround
Early on Monday morning ET, President Trump ordered a 5-day pause on all military strikes against Iranian power plants and energy infrastructure. The announcement came after what Trump described as "productive discussions over the past two days toward fully resolving hostilities in the Middle East."
This marks the first direct negotiations between the US and Iran since the war began on 28 February. The pause is conditional on continued progress in talks, meaning strikes could resume at any point if negotiations stall.
Markets reacted immediately, with S&P 500 futures surging +2.5%, WTI Crude Oil prices dropping -9% while gold and silver recovering from the last few days historic sell-off.
The next 5 days could determine the trajectory of this war and global markets.
The paper-physical divide
The most technically striking development in commodity markets this week is one that futures screens do not fully capture. The charts say oil is trading at $97–$111 per barrel. But try buying actual physical barrels in the real world east of Suez, and the reality is profoundly different. Singapore fuel oil is changing hands at $140. Physical Oman crude is trading at $167. Bunker fuel — the marine fuel that powers global shipping — has reached $175 per barrel. The gap between paper and physical prices has opened to between 20% and 80%, representing one of the most significant dislocations in oil market history.
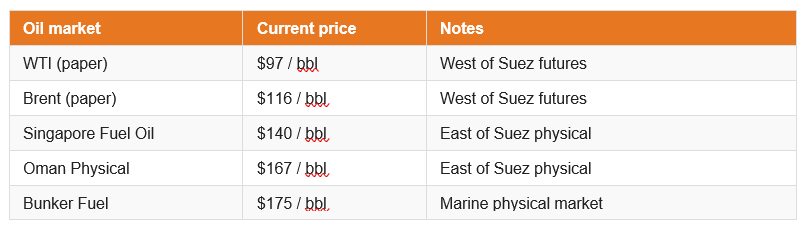
The divergence reflects a fundamental split in how markets are processing the crisis. East of Suez, where the physical shortage and the freight constraints are most acute, prices reflect real scarcity, delivery risk, and the absence of the barrels that normally transit Hormuz. West of Suez, traders are still pricing futures against the assumption that the system will eventually rebalance. SYZ Research's view is blunt: it will not rebalance smoothly, and the lag between paper and physical prices represents either a coming correction in futures or an acknowledgement — not yet priced — of a deeper structural disruption.
The Hormuz arithmetic
The Strait of Hormuz normally handles approximately 20.5 million barrels per day of oil traffic. A full closure, accounting for rerouting options and strategic reserve releases, would still leave global markets short by roughly 10 million barrels per day, according to analysis from UBS. Saudi Arabia can redirect approximately 5 mb/d via its East-West pipeline to the Red Sea port of Yanbu — and has done so impressively quickly, with Yanbu exports surging 185% from 1.47 mb/d to 4.19 mb/d within weeks. The UAE can add another 0.5 mb/d via the Habshan-Fujairah pipeline, and the IEA strategic reserve release contributes a further 3.3 mb/d. But even adding all of these together against a 20.5 mb/d gross loss leaves an irreducible deficit of approximately 10 mb/d.
The Saudi rerouting achievement is real and significant. The kingdom has recovered more than half its pre-war export capacity in a remarkably short period. But it is not a solution. Pre-war Saudi exports were approximately 7 mb/d, and pipeline capacity is already approaching its ceiling. More importantly, the Red Sea route that Yanbu exports now depend on is itself under growing threat: the Houthis have declared full military alignment with Iran, and shipping through the Red Sea is increasingly hazardous. The world may be watching one chokepoint problem migrate into another.
Global
Global growth is on a positive underlying trajectory, as can be seen in the stronger manufacturing cycle that we witnessed before the outbreak of the Middle East crisis.
But the Iran energy crisis is jeopardising this trend. The longer the conflict persists, the higher uncertainty rises. The more energy prices climb, recession risks also push upward. If we saw an outcome between scenario 1 and 2 (see our scenario analysis section), we believe global growth could within one or two quarters and avoid a potential recessionary trend. Additional geopolitical escalations, trade disputes, fiscal uncertainties, and possible central bank policy errors add to fragility. Consumer and company sentiment is vulnerable to a sharp downturn if energy tensions persist. Global inflation has continued its downward trend, but the recent spike in energy prices has shifted the near‑term outlook higher. The duration of the energy shock will be decisive for the disinflation path. Second‑round effects typically start to materialise after roughly two months and bear monitoring. Price pressures remain uneven: sticky in some major economies, like the US, modest in the Eurozone, and near zero in Switzerland and parts of Asia. Energy remains the key uncertainty for both growth and inflation outlook.
United States
Growth of the US economy continues to show broadly solid momentum, but the energy crisis could hamper this trajectory. Revisions revealed softer Q4 data, mainly due to weaker consumption, but early‑2026 indicators point to continued resilience. Consumption appears to be rebounding after the temporary Q4 dip, and there are still no signs of a more sanguine downturn in core domestic demand.
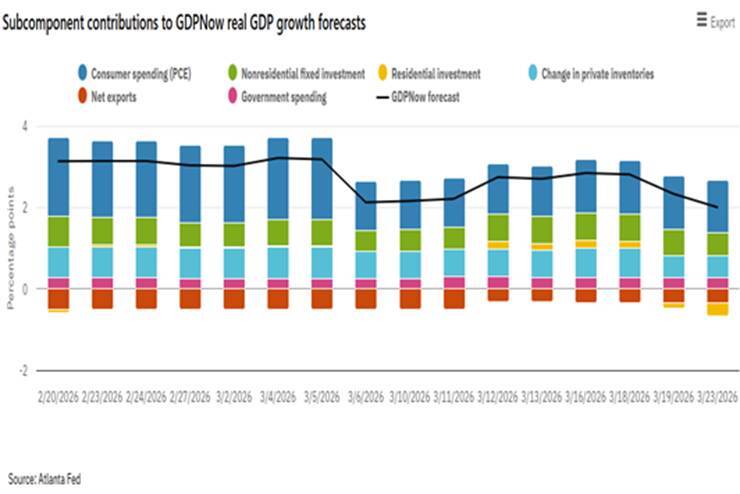
Risks have risen due to the energy price surge, higher household debt burdens, rising credit risks, and tariff‑linked pressures. If our mixture of scenario 1 and 2 (see scenario analysis section) will turn out to be the outcome, the US economy should still be able to weather the energy storm without drifting into a recession scenario US inflation remains above target. Underlying pressures are visible in services; however, shelter inflation is expected to ease further and help alleviate pressures. The US central banks most watched PCE core inflation measure rose above 3% last month, highlighting the dilemma it faces between persistent inflation and a weakening labour market.
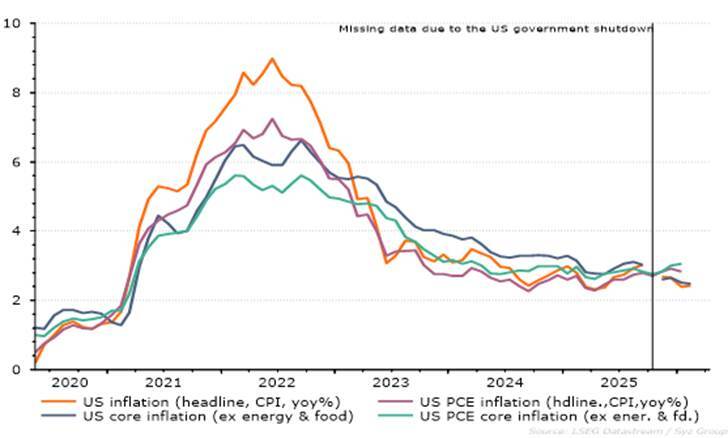
The energy shock risks slowing headline disinflation and may delay normalisation. Tariff related cost increases add to the near‑term profile. With activity still firm, second‑round effects are a risk, keeping the US among the complicated inflation cases in advanced economies.
Eurozone
The growth outlook in the Eurozone showed signs of recovery, supported by fiscal stimulus and improving consumer and business sentiment. Consumer confidence is stabilising from low levels, and business surveys are slowly improving. The energy shock linked to the Middle East crisis clouds the outlook, as prolonged elevated prices could restrain domestic demand. US tariffs and the wars in Iran and Ukraine continue to weigh on confidence. Political risks in France seem to be abating, removing one layer of uncertainty, but the recovery remains fragile.
 Eurozone inflation is broadly at the ECB’s target. Still weaker demand compresses domestic price pressures. The energy surge is likely to push up headline inflation. Second-round effects also appear more likely than in the US, reflecting fiscal measures introduced across the Eurozone to mitigate energy costs for consumers. This raises the risk of an inflationary spiral. Wage dynamics remain moderate, however, consistent with a still-contained inflation regime, albeit with energy as a significant upside risk.
Holding fire in a fog of uncertainty
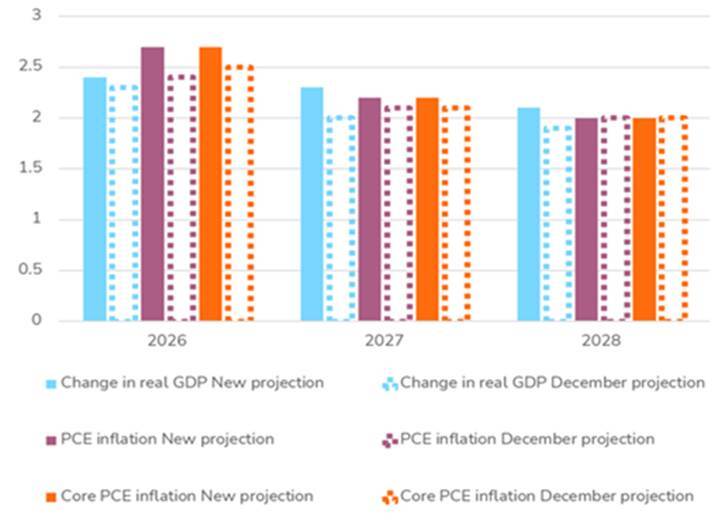
The Federal Reserve did precisely what was expected of it this week: nothing. The FOMC voted to hold its policy rate at 3.50–3.75%, with only one dissent — Governor Stephen Miran, who voted again for a rate cut. The more revealing signal came in the FOMC's updated projections, where core PCE inflation was revised upward from 2.5% to 2.7%, and in Chairman Powell's press conference framing of a 'wait and see' approach. The committee's stated rationale was honest: with the duration and magnitude of the energy shock uncertain, a definitive policy response is impossible. Powell acknowledged that the Fed cannot assess the current impact until it knows how long the crisis will last and at what price level.
Most FOMC members still project one rate cut in 2026, effectively 'looking through' the energy shock on the assumption that it is temporary and supply-driven rather than demand-driven. But markets have moved sharply in the other direction. Rate hike probabilities now exceed rate cut probabilities for the first time since the conflict began — markets have gone from pricing two cuts to pricing half a hike over the course of the Iran crisis. The two-year Treasury yield is now its most elevated above the Fed funds ceiling since 2023, when the central bank was still actively raising rates.
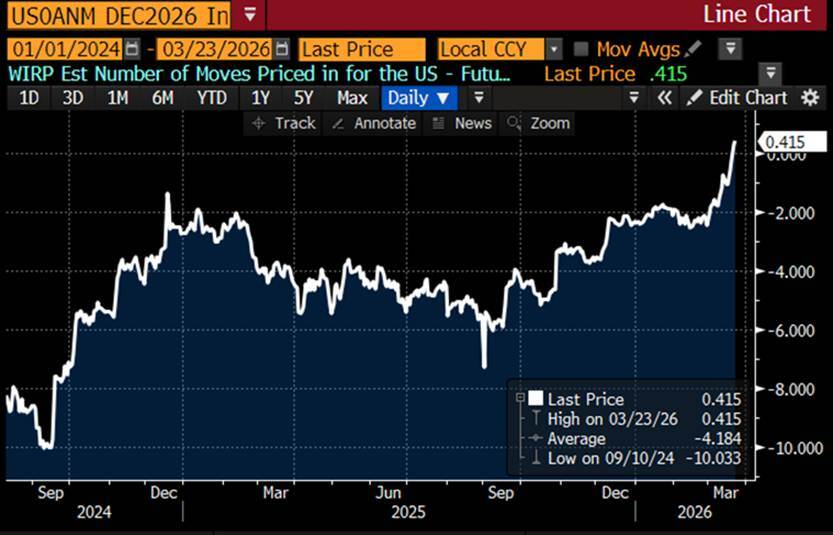
Markets have gone from pricing two cuts to pricing half a hike over the course of the Iran crisis.
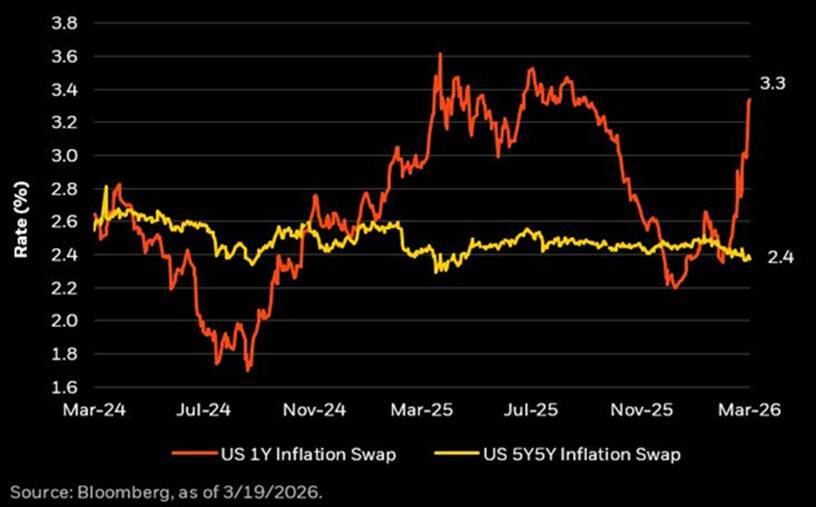
SYZ Research draws an important distinction in interpreting this data. Short-term inflation expectations — captured in one-year inflation swaps — have risen to 3.3%, driven by the energy shock and geopolitical risk premium. But long-term expectations — the five-year forward inflation swap, which captures what investors expect inflation to average over the five-year period beginning five years from now — remain anchored at 2.4%. This is the number that matters most to the Fed. If long-term expectations were breaking higher, the central bank would face genuine pressure to hike. The fact that they remain contained gives policymakers the room to stay patient and treat the current inflation spike as a one-off supply shock rather than an entrenched change in inflation dynamics.
Why 2026 is not 2022
The analytical trap that many commentators have fallen into is reaching for the Ukraine war as the template for the current situation. SYZ Research pushes back against this comparison. When Russia invaded Ukraine in February 2022, it added fuel to an inflationary fire that was already burning fiercely. The money supply had grown by 25% in 2021 — an unprecedented peacetime expansion — and that monetary acceleration was already feeding through into prices. The Fed was already behind the curve on inflation six months before the first Ukrainian city fell. The subsequent commodity shock simply accelerated a process that was already underway.
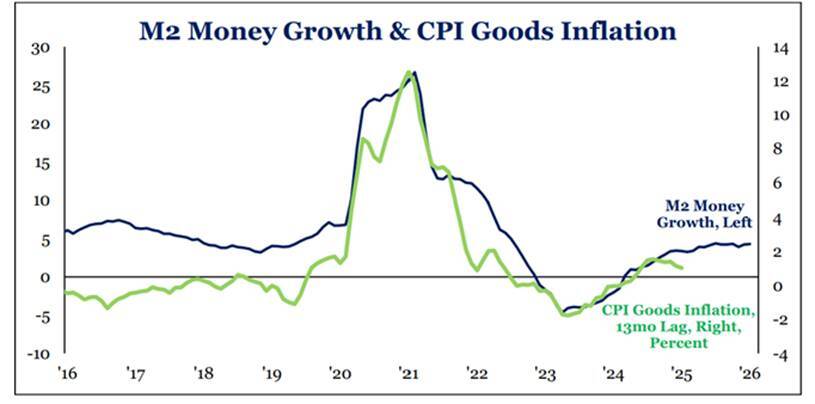
Today's situation is structurally different. Money supply is currently running below its historical average. There is no underlying monetary excess for the energy shock to amplify. Higher oil prices will spike consumer price indices in the short run, but they will simultaneously act as a tax on American consumers — reducing spending power and slowing the economy. The growth-damping effect of expensive oil will ultimately put downward pressure on activity, and SYZ expects the growth of the Fed's balance sheet to slow further after the April tax season, moderating M2 growth. The base case remains: watch the energy shock carefully, but do not mistake a supply-side price spike for the beginning of a second inflationary wave.
The Fed Chair question
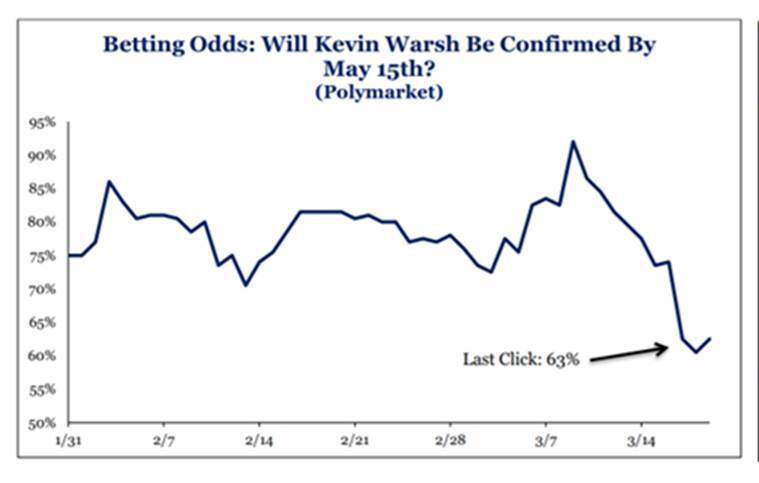
Complicating the monetary policy picture is an unusual degree of institutional uncertainty at the top of the Federal Reserve. Powell explained during his press conference that he intends to remain on the Board of Governors for as long as a criminal investigation related to his tenure is underway, and that he will serve as pro-tempore Chair until Trump's nominee, Kevin Warsh, is confirmed by the Senate. Prediction markets are currently pricing approximately 63% odds of Warsh's confirmation by 15 May. The prospect of a Fed Chair transition during an active geopolitical and economic crisis adds a layer of uncertainty to the policy outlook that markets are only beginning to price.
Other central banks – ECB and SNB
The ECB kept its key rate (deposit rate) stable at 2.0% and emphasised the large uncertainty due to the energy shock, but under a short‑lived conflict scenario the ECB is likely to look through temporary energy‑driven price spikes. However, the longer the crisis will keep energy prices high and the more European governments use fiscal measures to alleviate the negative effects of the energy price surge on demand, the more an inflation increase becomes likely and the ECB will react. If we see this scenario unfolding, we expect the ECB to start to raise key rates with a "pre-emptive hike" already at the next meeting in April. However, if the crisis calms down quickly, we expect no key rate changes this year.
At the last policy meeting in January, the Swiss National Bank kept its key rate at 0.0%, emphasising that a stronger CHF and lower energy dependence dampens the current energy price spike. While its inflation outlook has risen modestly on higher energy costs, it remains contained. In our Middle East base case, we expect the SNB to avoid a return to negative rates, while monitoring FX and energy developments.
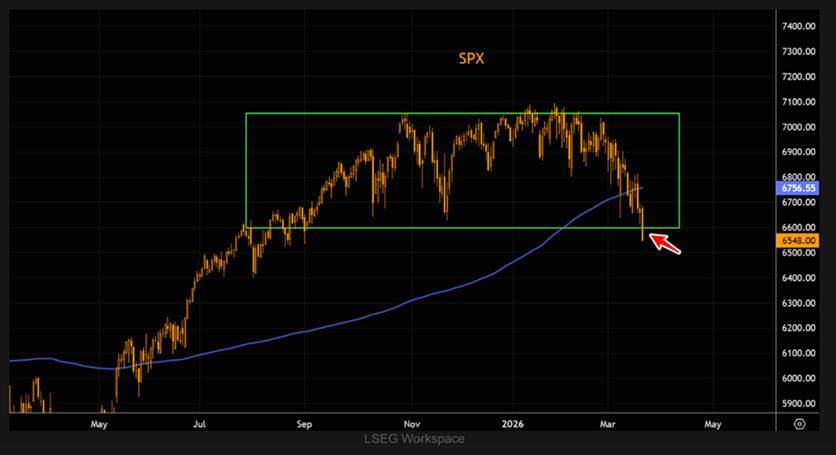
Equities: a market driven by geopolitical news flow
Equity markets remain very volatile. Last week, the S&P 500 itself closed below 6,600, breaking decisively through a major consolidation range and trading well below its 200-day moving average. The Nasdaq is in a similar position, with its 21-day moving average threatening to cross below the 200-day — a bearish technical signal.
The historical precedent is instructive, if not entirely comforting. Analysis of more than 30 major geopolitical shocks since 1939 suggests that equity markets typically reach their low point approximately one month after the initial shock, with the average peak drawdown at that point running just over 4%. That is precisely where markets stand today — at the statistical bottom of a typical geopolitical sell-off. The critical uncertainty is whether this is a typical geopolitical event. If it escalates into a regional war involving GCC countries, or if the physical oil market dislocation deepens, the typical playbook may not apply.
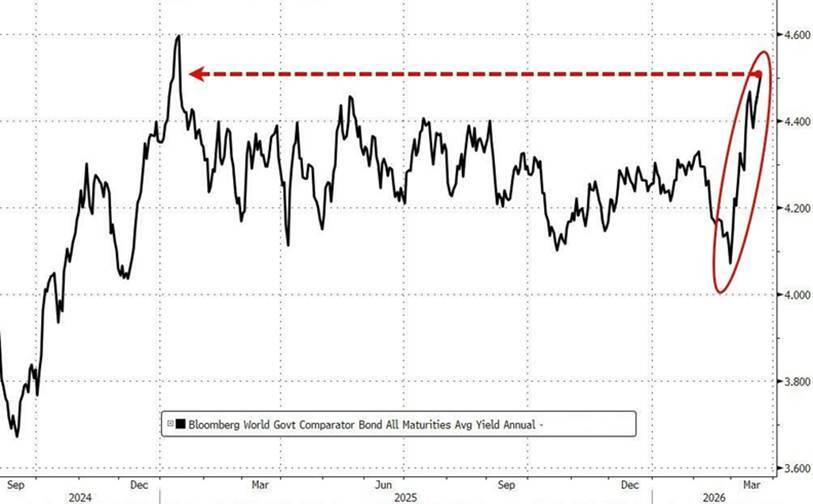
Fixed Income: the yield surge and its implications
The global bond market had a bruising week. US 10-year Treasury yields spiked 13 basis points on Friday alone, reaching 4.38% — the second-largest single-day move since the April 2025 Liberation Day sell-off. Since early March, the 10-year yield has risen by 45 basis points, the fastest pace of increase in nearly a year. The sell-off in bonds is being driven by three interlocking forces: soaring oil prices inflaming near-term inflation concerns; hawkish signals from both the Fed and the Bank of England; and forced deleveraging by hedge funds that had been running leveraged positions in the Treasury market and are now being compelled to unwind at a loss.
In Germany, the picture is structurally more significant. The 10-year Bund yield has crossed 3% for the first time since 2011 — a threshold that marks a fundamental change in the European fiscal landscape. The increase is being driven disproportionately by higher long-term inflation expectations rather than real yield increases; real 10-year yields have actually fallen from 1.35% to 0.77% as nominal yields and breakeven inflation have moved together. The context matters: between 2014 and 2022, Germany benefited from negative real yields that allowed it to effectively reduce its debt burden in real terms while doing relatively little. Since the suspension of the constitutional debt brake in 2025, investors have begun demanding meaningfully higher real returns — and the energy shock has accelerated that process.
The most acute risk in fixed income is what happens if yields continue to rise. A further increase of 20–30 basis points in 10-year US yields from current levels could trigger a liquidation cascade across asset classes, as institutional trading desks exhaust their risk budgets and are forced to reduce exposure indiscriminately — a dynamic broadly similar to the market stress episode of April 2025.
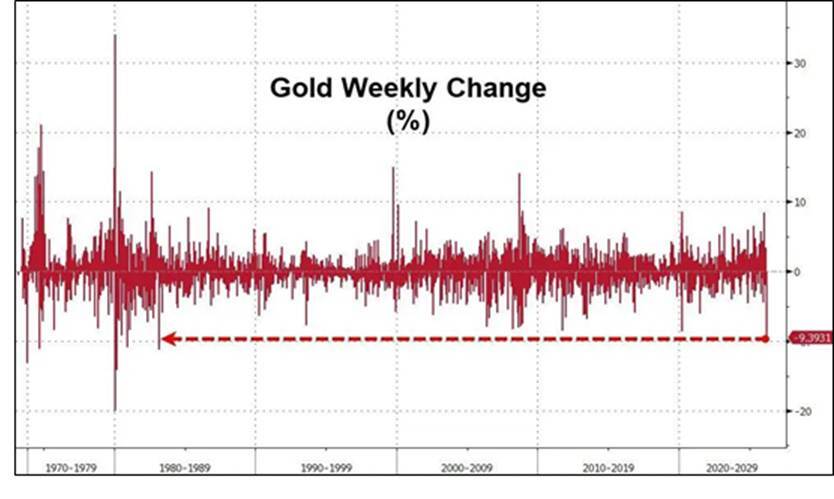
Gold: the worst week in 43 years
Of all the week's market dislocations, none was more dramatic or counterintuitive than gold's performance. The yellow metal suffered a decline of 9.4% on the week — its worst performance since 1983 — falling through the psychologically important $5,000 level and reaching seven-week lows. Silver fell 11.4% and platinum shed 11.6%. The precious metals complex, which had been building toward what many investors viewed as a secular breakout driven by de-dollarisation, central bank reserve diversification, and geopolitical uncertainty, reversed violently.
SYZ Research identifies two distinct explanations that together account for the severity of the move. The first is structural: the Iran conflict, and specifically the Hormuz blockade, has disrupted the revenue flows of the world's major oil-exporting nations. Saudi Arabia, the UAE, and Kuwait — all significant gold buyers — face shrinking petrodollar surpluses and may need to reduce purchases or even sell holdings to meet fiscal obligations. Simultaneously, China faces higher oil import costs that slow economic growth and reduce trade surpluses, leading to slower reserve accumulation and reduced gold demand. The conflict, in other words, has directly undermined two of the most powerful structural pillars underpinning the gold bull case.
The second explanation is behavioural. Prior to the outbreak of hostilities, gold and silver had increasingly become momentum-driven trades rather than purely structural investments. While the underlying demand thesis — de-dollarisation, central bank buying, geopolitical hedging — was legitimate, a significant wave of retail investors had entered the market via ETFs, social media-driven narratives, and low-friction trading platforms. This created what SYZ terms a 'momentum premium' embedded in the price: an additional layer of valuation that was fragile precisely because it was led by sentiment rather than fundamentals. When prices began to reverse, the same retail investors who had driven prices higher exited rapidly, generating gold ETF outflows that represented the largest monthly redemptions since April 2013. The conflict may have triggered the reversal; but the severity of the decline reflects the unwinding of speculative positioning built up during the preceding rally.
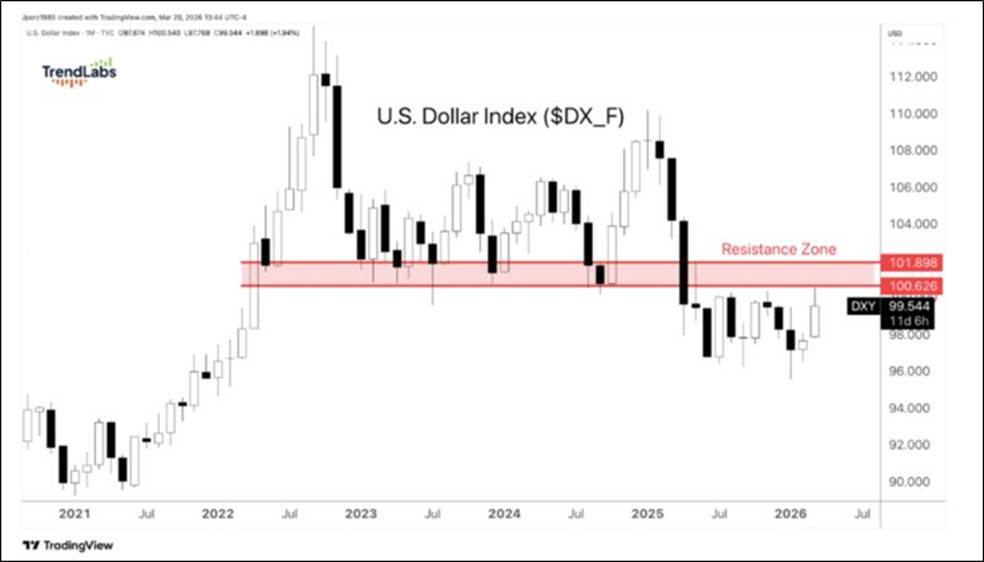
Currencies: the dollar's critical test
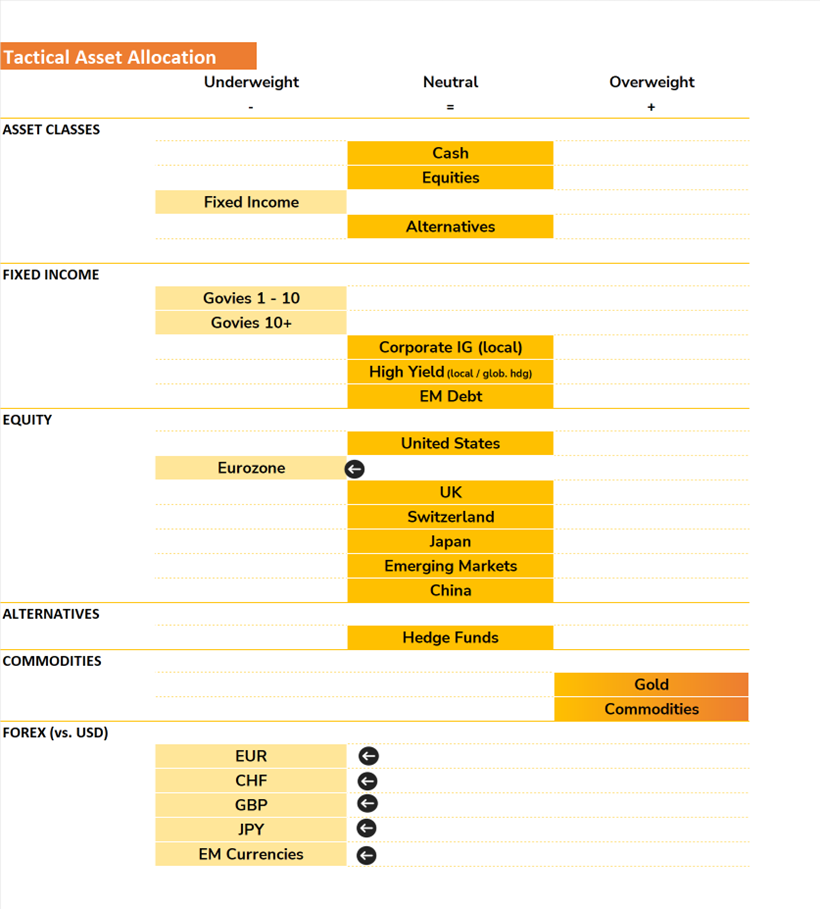
The US dollar has been strengthening since the onset of the Iran conflict, and the dollar index (DXY) is now testing a significant technical resistance zone. The dynamic is straightforward: when equities and bonds are simultaneously under pressure, capital must find somewhere to go, and in the current environment that somewhere is the dollar. SYZ Research has upgraded its USD stance from neutral to positive versus all currencies — EUR, CHF, GBP, JPY, and EM currencies — citing the dollar's safe-haven function, the hawkish repricing of Fed rate expectations, and the relative insulation of the US economy from the energy shock compared to major importers.
SYZ Research has articulated three scenarios for how the current crisis evolves, each with distinct implications for energy markets, growth, inflation, and asset prices. Taken together, these scenarios reflect the genuine binary uncertainty of the current moment: the difference between Scenario 1 and Scenario 3 is not merely a matter of degree but of kind — a different world entirely.
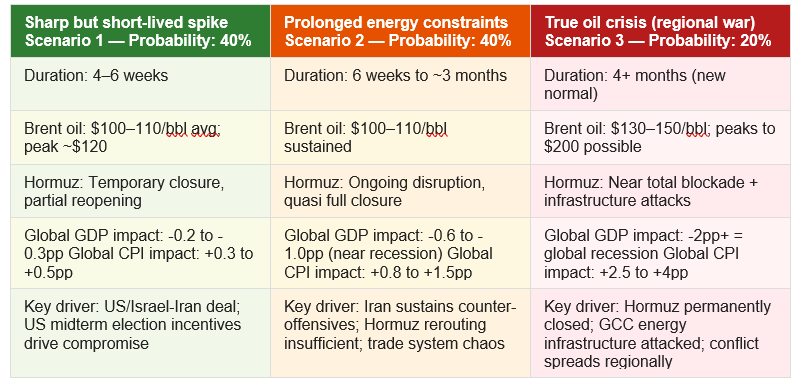
Scenario 1 and 2 each carry a 40% probability in SYZ's framework. Scenario 3, though the least likely, cannot be dismissed given the horizontal escalation dynamic that Iran is clearly pursuing. The ceasefire proposal currently on the table, if accepted, would represent a path toward Scenario 1. The threat to GCC desalination infrastructure, if executed, would almost certainly lock the world into Scenario 3.
The five-pillar framework
SYZ employs a five-pillar framework — Macro Cycle, Liquidity, Earnings Growth, Valuations, and Market Factors — to derive its tactical asset allocation. The week saw three of those five pillars downgraded, reflecting the deteriorating near-term outlook. The Macro Cycle pillar has moved from moderately positive to neutral, acknowledging that the prospect of a sustained growth and moderate inflation environment has been meaningfully compromised. The Liquidity pillar has followed the same path: higher inflation expectations have reduced the probability of the two rate cuts that markets anticipated before the conflict began, and the strengthening dollar — historically a headwind to global liquidity — is adding further pressure. The Earnings Growth pillar has been downgraded from positive to moderately positive; earnings remain resilient for now, but higher energy costs and rising interest rates will almost certainly drive negative revisions, particularly in energy-sensitive regions. Valuations remain neutral, and Market Factors remain moderately positive — the latter reflecting the relative resilience of US technical and breadth indicators compared to Europe.
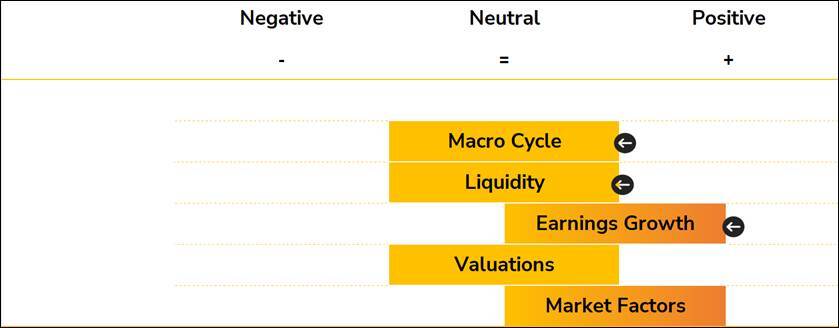
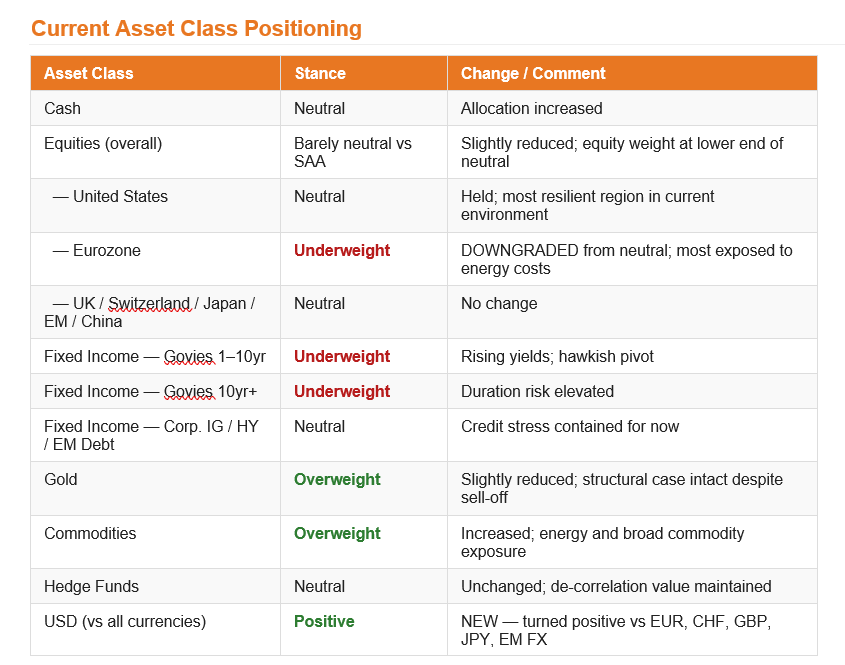
The logic behind these positioning changes is internally consistent. European equities are the most directly exposed to the energy shock — through higher input costs, compressed consumer spending, and the secondary effects of subsidised energy on fiscal deficits. Trimming that exposure while rotating into commodities and long dollar reflects a portfolio designed for a world in which energy prices remain elevated for longer than consensus assumes, and in which the US — despite its own challenges — remains the most resilient developed economy in the room.
On gold, the overweight position has been modestly reduced in response to the week's dramatic sell-off and the structural headwinds identified above. But SYZ has not abandoned the position. The underlying thesis — that central banks will continue diversifying reserves away from the dollar, geopolitical risk will remain elevated, and that gold's long-run role as a store of value is undiminished — remains intact. The momentum-driven retail positioning that amplified the recent decline will eventually clear, and what remains will be the structural demand that underpinned the rally in the first place.
The Iran conflict has sparked a significant oil shock, and how long the disruption lasts will be critical in shaping both economic and market outcomes.
However, this situation is unlikely to mirror the 1970s. Energy represents a smaller portion of consumer spending today, the US is more insulated on the supply side, and the economy overall is less dependent on oil. That being said, the biggest energy importers (Emerging Markets and Europe) might be more impacted.
Our base case assumes a sharp but temporary (1 to 3 months) increase in oil prices. The impact on economic growth and inflation will depend on the length of the energy shock. In the meantime, the Fed is expected to remain cautious. Policymakers are likely to look through a one-off, energy-driven inflation spike, though inflation expectations will remain a key factor to watch.
Market volatility may stay elevated, but solid underlying fundamentals should offer some support. If oil prices remain high, energy stocks, US large caps, and technology may prove more resilient. Conversely, if tensions ease, small caps, value stocks, and international equities could take the lead.
Given the high level of uncertainty in the near-term, we reduced further our exposure to equities by trimming our exposure to European equities, among the region which is the most impacted by rising energy costs. We also added some de-correlated trades, the long dollar and additional exposure to commodities.