Charles-Henry Monchau

Chief Investment Officer

Story #1 — 

A volatile but positive quarter for markets 

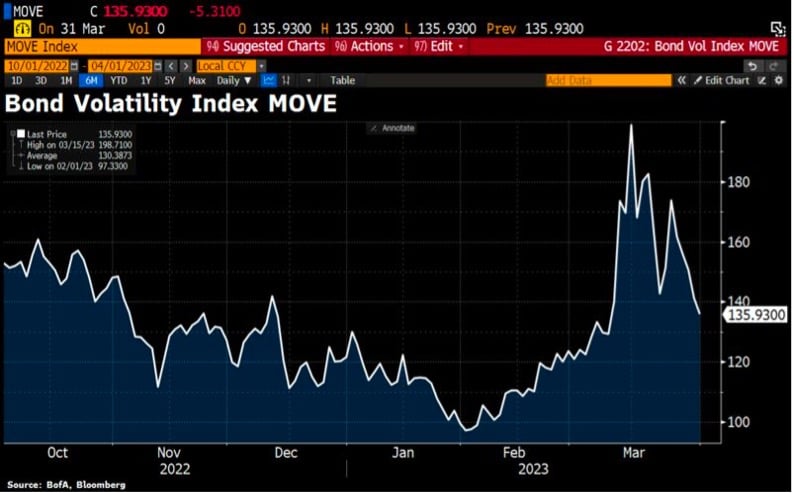
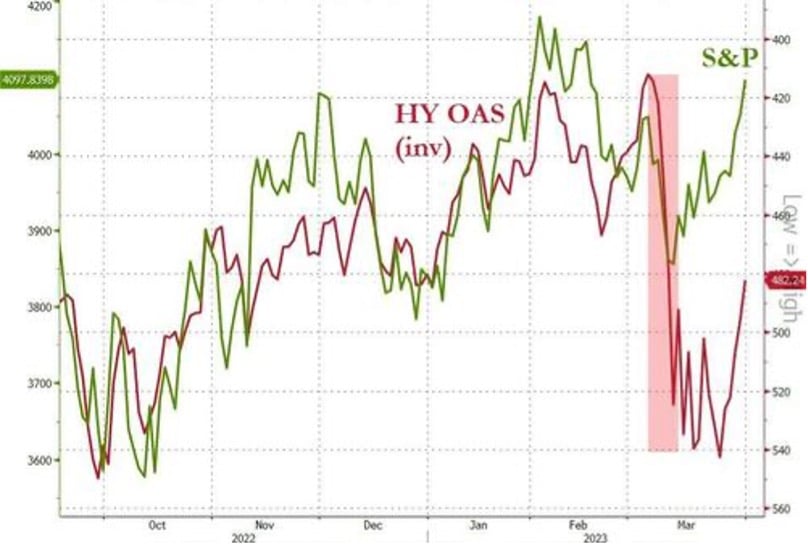
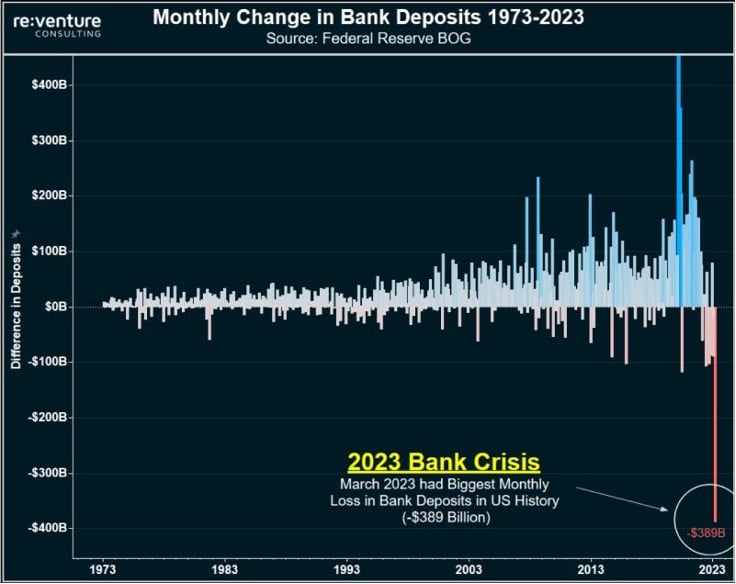
Q1 2023 was a turbulent period in markets, with a surge in volatility (especially in bonds) during March, following the collapse of Silicon Valley Bank. That led to fears about broader contagion across the banking system, while the sudden implosion of Credit Suisse led to its acquisition by UBS with guarantees from the Swiss government, and further bank crisis fears. Some of the US Treasuries’ daily moves were the largest in decades, and the MOVE index of Treasury volatility hit levels last seen at the height of the2008 global financial crisis (see story #3). 

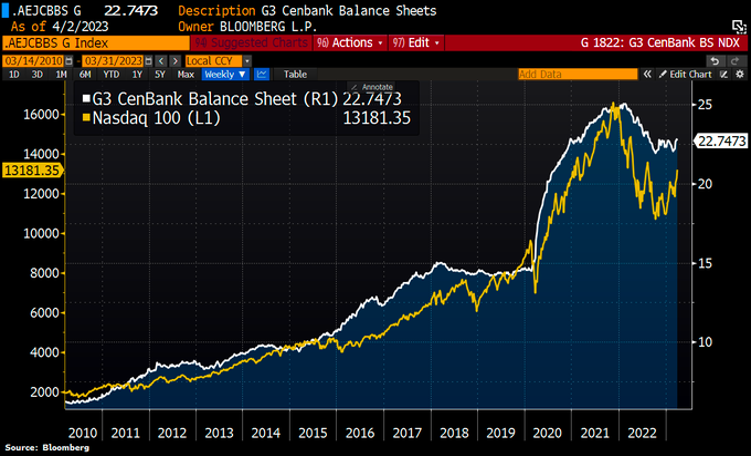
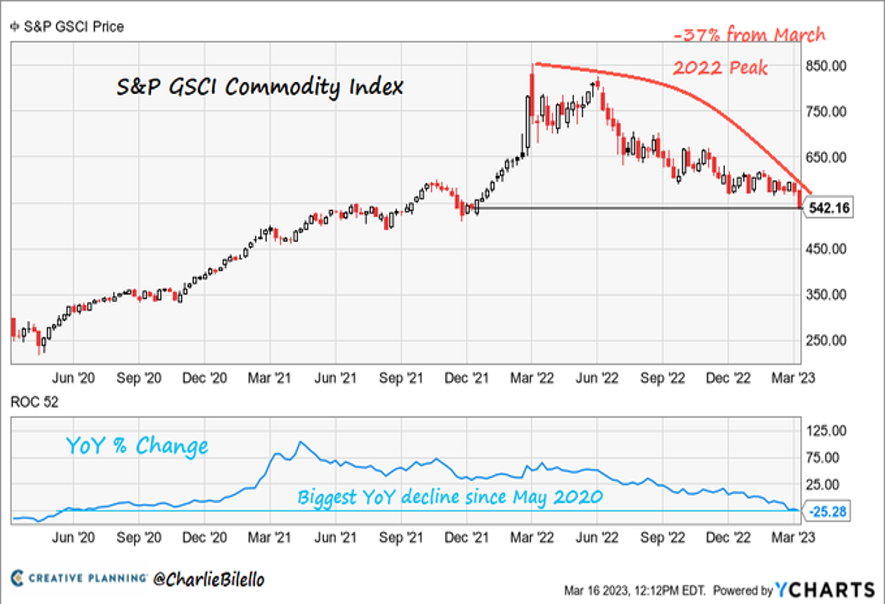
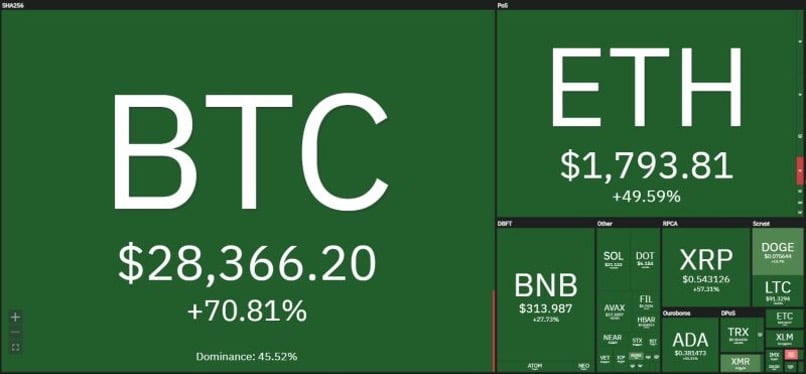
By the end of the quarter, market fears had subsided due to 1) markets’ anticipations that the Fed's rate hike cycle is effectively over; 2) the rise of the Fed’s balance sheet being seen by many market participants as a “stealth QE”. While the banking crisis might be a warning signal that the rapid series of central bank rate hikes is finally breaking something, Q1 as a whole saw some incredibly broad gains after the weakness of 2022, with advances for equities, credit, sovereign bonds, Emerging markets assets and cryptocurrencies (see story #10). The only major exception to that pattern were commodities (see story #9), with oil prices losing ground in every month of Q1. 
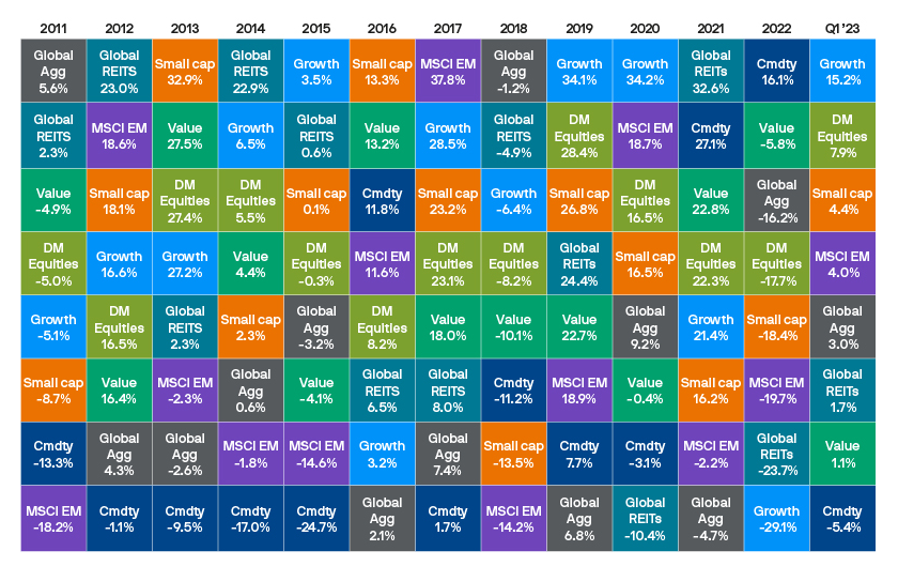
Picture1-Apr-06-2023-07-22-30-4862-AM

Source: JP Morgan


Story #2 — 

A hawkish start of the quarter 


he year started on a positive note with a strong rebound of risk assets in January following an awful 2022. A warmer Winter than expected led to a sharp drop in European natural gas prices (-24.8% over January), decreasing the odds of a hard landing for the economy. Various consumer sentiment indicators surprised on the upside in the US and Europe. The China economy’s post-covid reopening continued, boosting hopes that global growth would be lifted more broadly. 

But as we moved into February, markets mood became more negative. This was mainly due to a series of strong US macro data (e.g unemployment falling to a 53-year low of 3.4%) and higher-than expected inflation, which led investors to increase the amplitude of future rate hikes.. In the Euro Area, data released in February also surprised on the upside with core inflation hitting a record high of +5.3% in January. This set of strong data sparked a major sell-off among global bonds, with Bloomberg’s Global Aggregate Bond Index (-3.3%) seeing its worst February performance since its inception back in 1990.

By March, fears of stubbornly high inflation leading to a higher Fed terminal rate was validated by Fed Chairman Powell, who said in his semi-annual congressional testimony that “we would be prepared to increase the pace of rate hikes”, which explicitly opened the door to 50bp moves again. Shortly afterwards on March 8, 2yr yields closed at a post-2007 high of 5.07% while the 2s10s curve closed at an inverted -109 bps that day, which hadn’t been seen since 1981.


Story #3 — 

A roller coaster month of March for the MOVE index  


But by mid-March, the hawkish tone suddenly receded as concern grew about the financial system after Silicon Valley Bank collapsed, raising fears of broader contagion. Credit Suisse then came under investor scrutiny and saw large deposit outflows, which culminated in a purchase by UBS that included guarantees from the Swiss government. This led to significant market turmoil, and investors speculated that central banks could soon call for the end of the current hiking cycle, with yields on 2-year Treasuries seeing their largest daily decline since 1982 on March 13. Bank stocks were also hit, with the KBW Bank Index down -17.9% over Q1, despite the broader equity rally.

However, by the end of the month, there were signs that calm was finally returning to financial markets. Measures of volatility had come down substantially. The CBOE VIX volatility index fell back below 20. The MOVE Index – which measures Treasury volatility – spiked in March but then eased by the end of the quarter, which seems to indicate that financial stress is receding. 

And with investors far less concerned about aggressive rate hikes, sovereign bonds put in a very strong performance. In fact, US Treasuries (+3.3%) just experienced their best quarter since the pandemic turmoil of Q1 2020, back when investors poured into safe havens and the Fed slashed rates to zero and restarted QE. For Euro sovereign bonds (+2.4%) it was also their best quarter since Q3 2019, bringing an end to a run of 5 consecutive quarterly declines.

Picture2-Apr-06-2023-07-25-09-5315-AM

Source: Bloomberg


Story #4 — 

Solid gains for equity markets 


Despite the market turmoil, equities overall saw solid gains over Q1. For instance, the S&P 500 (+7.5%), the STOXX 600 (+8.6%) and the Nikkei (+8.5%) all advanced on a total return basis. The NASDAQ (+17.0%) had its best quarter since the Q2 2020,  being the biggest beneficiary of the banking crisis liquidity move. As shown below, the Nasdaq 100 and the combined balance sheet of the Fed, ECB, and Bank of Japan move in tandem. 

Picture4-Apr-06-2023-07-28-17-6416-AM

Source: Bloomberg


Story #5 — 

US equity markets were led by mega-caps 


The entire market cap gains for the S&P 500 this year came from the top 15 largest companies. The remaining part of the index actually lost value year-to-date. Mega caps tech stocks (+31% in Q1 vs. +2% for the rest of the S&P 500) are masking the issues in the overall market. 

S&P 500 performance in q1: only 10 companies were responsible for a massive 90% of the market's 7.49% performance

Picture5-Apr-06-2023-07-30-04-2374-AM


Story #6 — 

Style rotation in full speed


Tech (+22%) and Consumer Discretionary (+15%) dramatically outperformed in Q1 while Energy (-5%) and Financials (-6%) lagged. Last year losers were Q1 winners and vice-versa.

US growth stocks have dominated Q1, crushing value stocks. For context, this is the biggest growth/value quarter since Q1 2020 (and before that Q1 2009).Technology is now trading almost as rich as it has ever traded to the overall market...

Picture6-Apr-06-2023-07-30-59-9956-AM

Source: Bloomberg, www.zerohedge.com 


Story #7 — 

Credit spreads widened in March


It was a decent start of the year for credit, with gains across all indices in USD, EUR and GBP credit. The strongest gains were seen among GBP IG non-fin (+4.3%) and US HY (+4.2%), whereas the weakest was among EUR Fin Sub (+1.1%). Having struggled in 2022, emerging markets saw a much better start to 2023 across the major asset classes: EM Bonds were up +4.9% over the quarter.

While credit benefited from the carry, we note that High Yield bond spreads in US and EU are wider in Q1 after blowing out wider in March, erasing all the compression from January / February. While stocks bounced back above pre-SVB levels, the credit market remains much more stressed (even with the rally of the last 2 days of the quarter).

Picture7-Apr-06-2023-07-37-08-2230-AM

Source: Bloomberg, www.zerohedge.com


Story #8 — 

US bank run in slow motion continues. Money market funds are the biggest beneficiaries  


eposits at commercial banks dropped by $125.7bn in week ended Mar22, marking 9th-straight period of declines, highlighting preference for higher-yielding money-market funds. 

US Banks lost nearly $400 Billion in deposits in March, which is the biggest monthly loss in deposits in US history. This data shows the gravity of the Banking Crisis. And why the Government acted so quick to bail out depositors.

Meanwhile, US money markets funds TOTAL ASSETS just hit a new all-time-high of $5.1 Trillion, up more than $500B in the last 3 months and 2x in 5 years. With average interest rates being way above bank deposit rates (3.3% vs. 0.58%), they continue to attract huge assets. 

Picture8-1

Source: re-venture


Story #9 — 

Commodities were the only major asset class to lose ground over Q1 


Brent crude oil prices were down -7.1%, marking a third consecutive quarterly decline for the first time since 2014-15. In Europe, natural gas futures were down -37.3% over Q1, building on their -59.6% decline in Q4 last year. And plenty of agricultural commodities also fell back, including wheat (-12.6%), corn (-2.7%) and soybeans (-0.9%). The S&P GSCI Commodity Index is down 37% from its peak in March 2022, at its lowest level since December 2021.

Precious metals were the bright spot within commodities. Gold (+8.0%) and silver (+0.6%) prices both advanced over Q1. Prices have been supported by growing demand for safe havens, along with the prospect that central banks might be ending their hiking cycles shortly. That came after some very strong performances in March specifically, with gold up +7.8% over the month and silver up +15.2%. Gold is up for the second quarter in a row (up over 19% in the  last 6 months - its best such gain since 2016), with its highest quarterly close in history.

Picture9-1

Source: Charlie Bilello


Story #10 — 

The crypto come-back


After significant losses in 2022, cryptocurrencies rebounded strongly in Q1. Bitcoin had its best quarterly performance in two years, with a +70% advance that pushed it back to $28,500. Ethereum is also up for 3 straight months, best quarter since Q1 2021, nearing a 7-months high at $1850. Bloomberg’s Galaxy Crypto Index was up nearly +60% over the quarter.

Crypto heatmap (% return for Q1 2023) by market cap size

Picture10-2

Source: Bloomberg

Disclaimer

This marketing document has been issued by Bank Syz Ltd. It is not intended for distribution to, publication, provision or use by individuals or legal entities that are citizens of or reside in a state, country or jurisdiction in which applicable laws and regulations prohibit its distribution, publication, provision or use. It is not directed to any person or entity to whom it would be illegal to send such marketing material. This document is intended for informational purposes only and should not be construed as an offer, solicitation or recommendation for the subscription, purchase, sale or safekeeping of any security or financial instrument or for the engagement in any other transaction, as the provision of any investment advice or service, or as a contractual document. Nothing in this document constitutes an investment, legal, tax or accounting advice or a representation that any investment or strategy is suitable or appropriate for an investor's particular and individual circumstances, nor does it constitute a personalized investment advice for any investor. This document reflects the information, opinions and comments of Bank Syz Ltd. as of the date of its publication, which are subject to change without notice. The opinions and comments of the authors in this document reflect their current views and may not coincide with those of other Syz Group entities or third parties, which may have reached different conclusions. The market valuations, terms and calculations contained herein are estimates only. The information provided comes from sources deemed reliable, but Bank Syz Ltd. does not guarantee its completeness, accuracy, reliability and actuality. Past performance gives no indication of nor guarantees current or future results. Bank Syz Ltd. accepts no liability for any loss arising from the use of this document.

Read More

Straight from the Desk

Syz the moment

Live feeds, charts, breaking stories, all day long.

Thinking out loud

Sign up for our weekly email highlighting the most popular posts.

Follow us

Thinking out loud

Investing with intelligence

Our latest research, commentary and market outlooks