25 Apr 2024

Meta plunges 18% on weak revenue guidance even as first-quarter results top estimates.

$META Meta Q1 FY24: Daily active people +7% Y/Y to 3.2B. Ad impressions +20% Y/Y. 
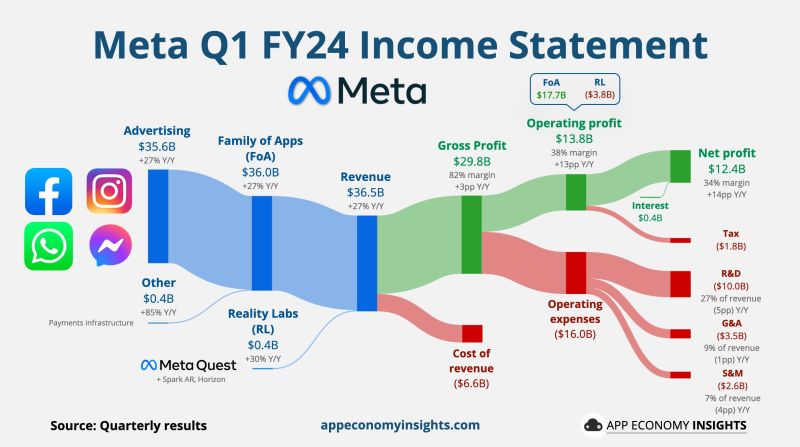
• Revenue +27% Y/Y to $36.5B ($0.2B beat), the fastest rate of expansion for any quarter since 2021. • Operating margin 38% (+13pp Y/Y). • FCF margin 34% (+10pp Y/Y). • EPS $4.71 ($0.39 beat). • FY24 Capex $35-40B ($30-$37B prev.) • Net income more than doubled to $12.37 billion, or $4.71 per share, from $5.71 billion, or $2.20 per share, a year ago. One reason for the pop in net income is that, while revenue growth accelerated, sales and marketing costs dropped 16% in the quarter from a year earlier. Meta said it expects sales in the second quarter of $36.5 billion to $39 billion. The midpoint of the range, $37.75 billion, would represent 18% year-over-year growth and is below analysts’ average estimate of $38.3 billion. The stock selloff accelerated early in the earnings call after Zuckerberg jumped into his discussion about investments, namely in areas like glasses and mixed reality, where the company doesn’t currently make money. The company no longer reports daily active users and monthly active users. It now gives a figure for what it calls “family daily active people.” That number was 3.24 billion for March 2024, a 7% increase from a year earlier. Meta has raised investor expectations due to its improved financial performance in recent quarters, leaving little room for error. The stock is up about 40% this year after almost tripling last year. Source: App Economy Insight, CNBC

Disclaimer

This marketing document has been issued by Bank Syz Ltd. It is not intended for distribution to, publication, provision or use by individuals or legal entities that are citizens of or reside in a state, country or jurisdiction in which applicable laws and regulations prohibit its distribution, publication, provision or use. It is not directed to any person or entity to whom it would be illegal to send such marketing material. This document is intended for informational purposes only and should not be construed as an offer, solicitation or recommendation for the subscription, purchase, sale or safekeeping of any security or financial instrument or for the engagement in any other transaction, as the provision of any investment advice or service, or as a contractual document. Nothing in this document constitutes an investment, legal, tax or accounting advice or a representation that any investment or strategy is suitable or appropriate for an investor's particular and individual circumstances, nor does it constitute a personalized investment advice for any investor. This document reflects the information, opinions and comments of Bank Syz Ltd. as of the date of its publication, which are subject to change without notice. The opinions and comments of the authors in this document reflect their current views and may not coincide with those of other Syz Group entities or third parties, which may have reached different conclusions. The market valuations, terms and calculations contained herein are estimates only. The information provided comes from sources deemed reliable, but Bank Syz Ltd. does not guarantee its completeness, accuracy, reliability and actuality. Past performance gives no indication of nor guarantees current or future results. Bank Syz Ltd. accepts no liability for any loss arising from the use of this document.

Read More

Straight from the Desk

Syz the moment

Live feeds, charts, breaking stories, all day long.

Thinking out loud

Sign up for our weekly email highlighting the most popular posts.

Follow us

Thinking out loud

Investing with intelligence

Our latest research, commentary and market outlooks