
Charles-Henry Monchau, CFA, CMT, CAIA

Chief Investment Officer

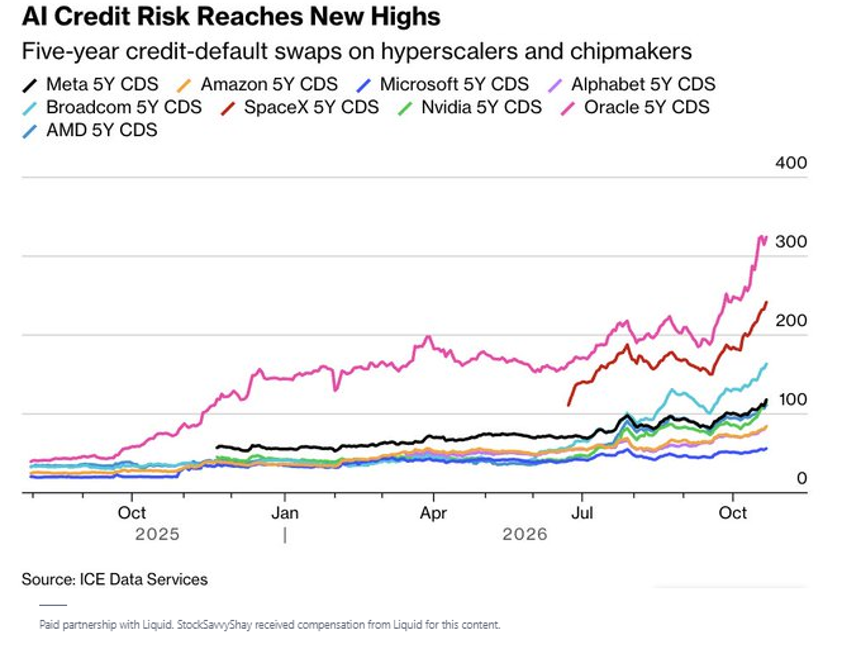
Chart #1 — 

AI’s debt bill is becoming a problem for tech stocks

Five-year credit default swap (CDS) spreads indicate how much investors pay to insure corporate debt against default. Their recent increase points to growing caution about the financing outlook for major AI companies.

Oracle’s spread is approaching 300 basis points, implying an annual premium of approximately USD 300,000 to protect USD 10mn of debt. SpaceX and Broadcom have also recorded substantial increases.

The concern is whether future AI revenues can support the vast sums now being committed to semiconductors, data centres and energy infrastructure.

For equity markets, the implications run through three main channels:

  • Financing: more expensive borrowing can weaken the expected returns on new investment.
  • Valuations: elevated capital expenditure reduces available cash, and uncertainty over future profitability can weigh on earnings multiples.
  • Contagion: if cloud operators moderate their spending, orders for chipmakers and infrastructure providers may slow.

The heavy representation of AI-related companies in the Nasdaq means that changes in sentiment towards the sector can have an outsized effect on the index.

Wider CDS spreads suggest greater risk aversion but do not necessarily point to imminent defaults. They are also only one of several factors behind the recent weakness in technology shares.

Source: Bloomberg
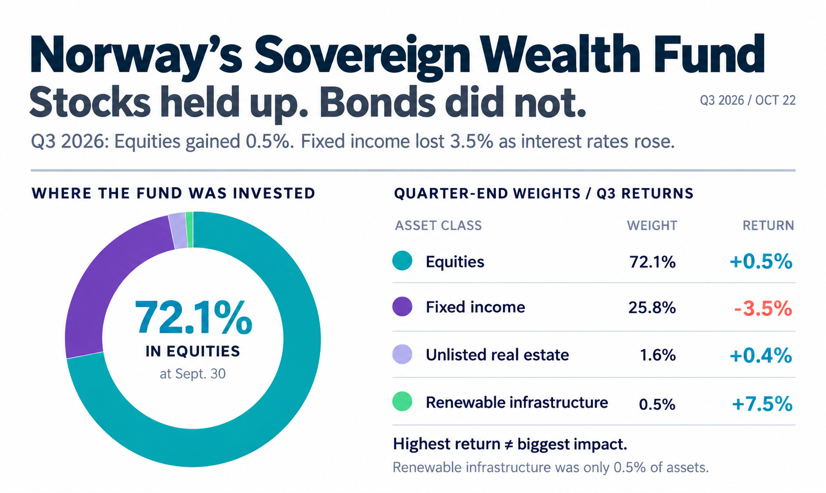


Chart #2 — 

World’s largest wealth fund posts $30bn loss after bond market turbulence


A positive contribution from equities was insufficient to offset weakness in bonds and the appreciation of the Norwegian krone. Norway’s sovereign wealth fund ended Q3 with a loss of roughly USD 30bn.

The fund recorded a quarterly decline of NOK 278bn, with rising interest rates reducing the value of its fixed-income holdings.

For a portfolio worth about USD 2.3tn, the result illustrates the impact that interest-rate and currency movements can have, even on highly diversified institutional portfolios.


Source: AInvest Wire


Chart #3 — 

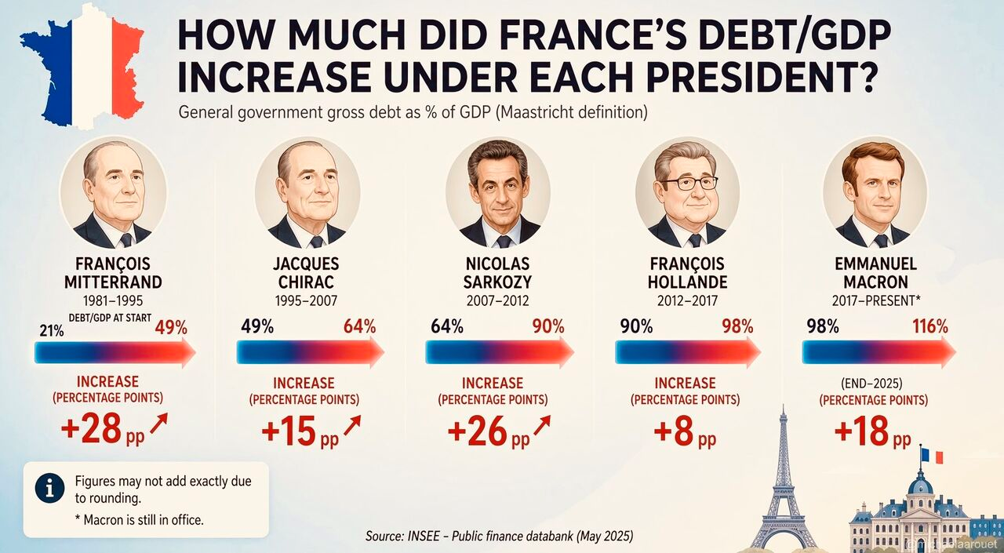
France’s debt problem has no single political owner

Years of persistent budget imbalances have taken France’s public debt close to 120% of GDP. Higher government bond yields increase debt-servicing costs. That adds pressure to fiscal deficits and, in turn, creates a need for further borrowing.

Subdued economic growth offers limited relief. Opposition to reform and recurring political instability also make a sustained fiscal adjustment difficult to deliver. The longer borrowing costs stay elevated, the more demanding the outlook becomes for France’s public finances.

For European investors, the implications extend beyond France. A deterioration in confidence in French sovereign debt could also put pressure on the wider euro area.

Source: Michel A. Arouet, INSEE


Chart #4 — 

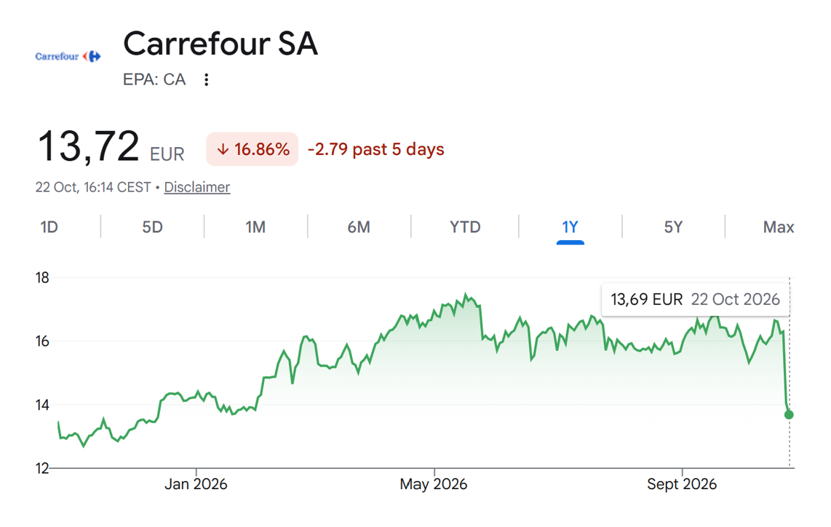
France’s fiscal problem is becoming a corporate earnings problem

Carrefour shares reportedly dropped by more than 13% on Wednesday after the retailer lowered its outlook. It warned that looting and disruption across its stores could reduce operating income by EUR 80–200mn.

The pressures facing businesses come against an already difficult fiscal backdrop:

  • public debt stands near 119% of GDP
  • the government deficit exceeds 5% of GDP
  • public expenditure amounts to roughly 57% of GDP

Episodes of unrest can further weaken confidence, interrupt commercial activity and put tax receipts at risk.

The pressures can become self-reinforcing:

  • repeated budget shortfalls increase financing requirements
  • higher bond yields add to the interest bill
  • slow economic growth makes the fiscal adjustment more difficult
  • political opposition delays structural measures

A sovereign debt crisis is not a foregone conclusion. However, delaying fiscal decisions may make the eventual adjustment more costly. Given the scale of the French economy and its sovereign debt market, a severe fiscal shock would pose a much larger test for the euro area than the Greek crisis.

Source: Michel A. Arouet


Chart #5 — 

The Musk universe

This diagram traces the ownership interests, AI and chip partnerships, and commercial arrangements linking Elon Musk’s companies.

Source: Syz Bank


Chart #6 —

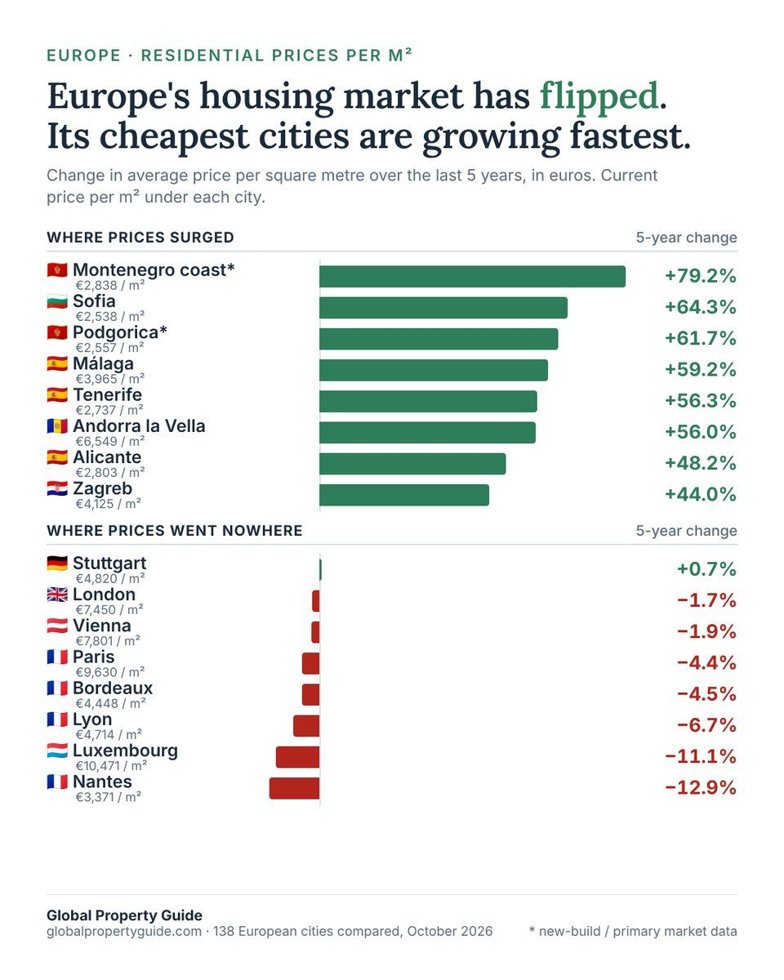
Europe’s housing markets are moving in different directions

Residential property prices per square metre have followed very different paths across European cities over the five-year period shown in the chart.

Luxembourg: −11%

Paris: −4%

London: −2%

Vienna: −2%

Montenegro coast: +79%

Sofia: +64%

Málaga: +59%

Alicante: +48%

Zagreb: +44%

Several established western European markets have seen limited price growth or outright declines. Gains have been much stronger in a number of comparatively affordable locations in southern and eastern Europe.

Source: Global Property Guide


Chart #7 — 

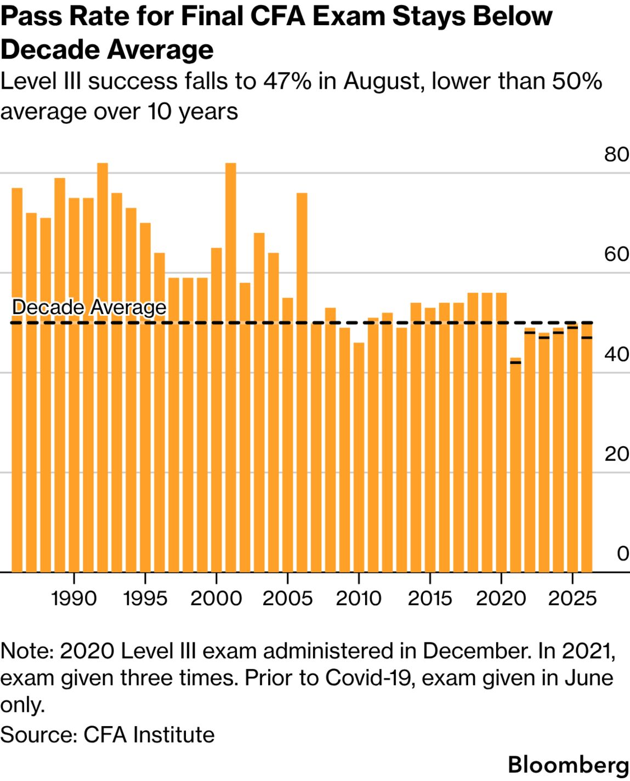
CFA Level III pass rate stays below its ten-year average

The pass rate for the August CFA Level III examination stood at 47%, according to CFA Institute data reported by Bloomberg.

That compares with 50% in both February and August 2025 and remains below the 50% average recorded over the previous decade. The pass rate has not surpassed that benchmark since 2020.

The figures also reveal a wide difference between candidates sitting the exam for the first time and those who had deferred it. First-time candidates achieved a 56% pass rate, compared with 31% among candidates with at least one deferral.

Source: Bloomberg


Disclaimer

This marketing document has been issued by Bank Syz Ltd. It is not intended for distribution to, publication, provision or use by individuals or legal entities that are citizens of or reside in a state, country or jurisdiction in which applicable laws and regulations prohibit its distribution, publication, provision or use. It is not directed to any person or entity to whom it would be illegal to send such marketing material. This document is intended for informational purposes only and should not be construed as an offer, solicitation or recommendation for the subscription, purchase, sale or safekeeping of any security or financial instrument or for the engagement in any other transaction, as the provision of any investment advice or service, or as a contractual document. Nothing in this document constitutes an investment, legal, tax or accounting advice or a representation that any investment or strategy is suitable or appropriate for an investor's particular and individual circumstances, nor does it constitute a personalized investment advice for any investor. This document reflects the information, opinions and comments of Bank Syz Ltd. as of the date of its publication, which are subject to change without notice. The opinions and comments of the authors in this document reflect their current views and may not coincide with those of other Syz Group entities or third parties, which may have reached different conclusions. The market valuations, terms and calculations contained herein are estimates only. The information provided comes from sources deemed reliable, but Bank Syz Ltd. does not guarantee its completeness, accuracy, reliability and actuality. Past performance gives no indication of nor guarantees current or future results. Bank Syz Ltd. accepts no liability for any loss arising from the use of this document.

Read More

Straight from the Desk

Syz the moment

Live feeds, charts, breaking stories, all day long.

Thinking out loud

Sign up for our weekly email highlighting the most popular posts.

Follow us

Thinking out loud

Investing with intelligence

Our latest research, commentary and market outlooks