

.png)
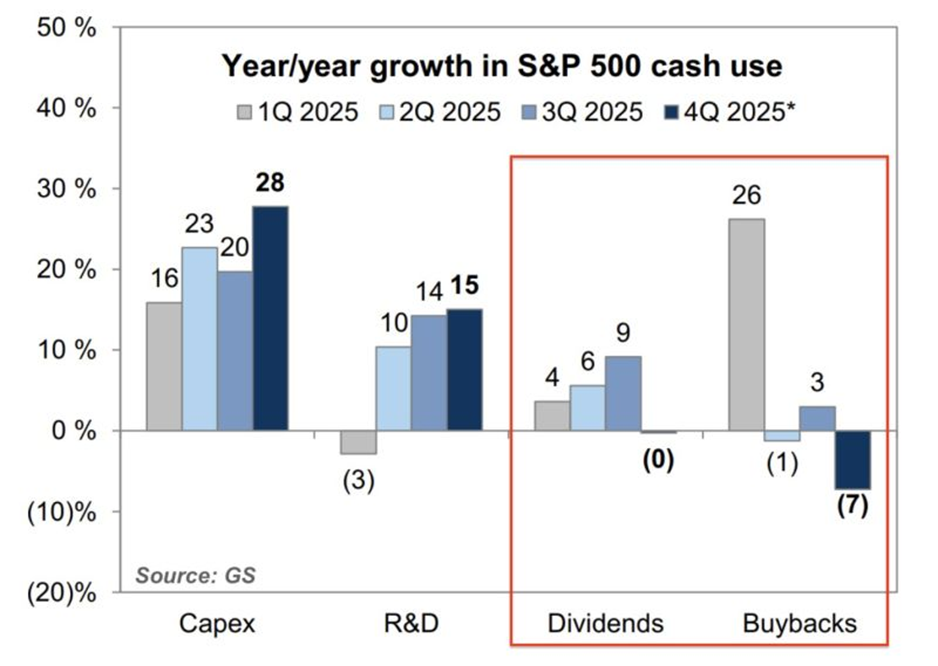 Source: Goldman Sachs
Chart #2 —
A new all-time high for Berkshire Hathaway cash reserves
Warren Buffett’s Berkshire Hathaway currently holds a record $382bn in cash reserves, an amount theoretically sufficient to acquire around 480 companies listed in the S&P 500.
 Source: FT
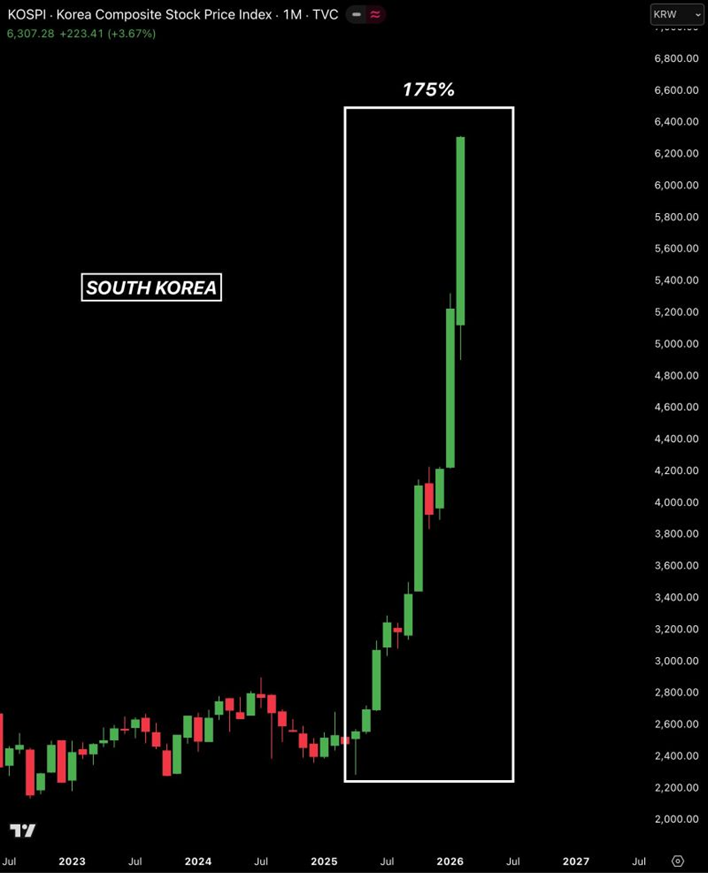
Chart #3 —
South Korea’s stock market hit a new all-time high with the KOSPI up ~175% YoY, making it one of the strongest global equity rallies
The recent rise in the market is mainly driven by semiconductor companies, which have a large weight in the index. Major firms such as Samsung Electronics and SK hynix strongly influence overall market performance, so higher expectations for chip industry profits push the entire market upward.
Export data supports this positive outlook. In early February, total exports increased by 47% year over year despite fewer working days. Semiconductor exports grew even faster, rising 134% compared to last year and now representing more than one-third of total exports, largely due to global demand for AI technologies.
Stronger chip exports improve profit expectations, which leads to higher stock prices.
At the same time, while Korean stocks continue to reach new highs, cryptocurrency markets have lagged.
South Korea is usually a retail-investor–driven crypto market, often showing a “Kimchi Premium,” where local crypto prices trade above global prices during bull markets. This premium has recently declined, suggesting reduced retail participation in crypto.
Since the October market crash, retail investors appear to have shifted their money away from cryptocurrencies and into domestic AI and semiconductor stocks.
Source: Bull Theory
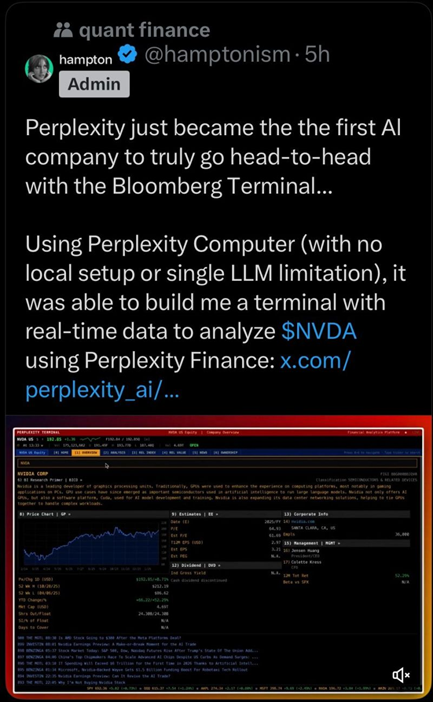
Chart #4 —
A Bloomberg Terminal costs $24,000 a year. Someone just recreated one using Perplexity Computer for $200 a month...
Bloomberg’s strength has never been its data—data is increasingly a commodity. Its true advantage lies in the interface:
- Thousands of keyboard shortcuts
- Proprietary screens
- Years of muscle memory built by finance professionals
The barrier to switching wasn’t cost. It was the time and effort needed to retrain.
AI agents can dismantle this advantage. If an AI can mimic the interface and access equivalent data from public or licensed sources, the lock-in disappears.
What remains are only two things:
- The chat network, which is a social feature
- Real-time market feeds, which rely on licensing agreements
Neither of these constitutes a strong technological advantage.
The bigger lesson applies to any product whose edge depends on users learning complex systems. AI doesn’t just learn your system. It can replace it entirely.
Source: Subodh WarekarSubodh Warekar
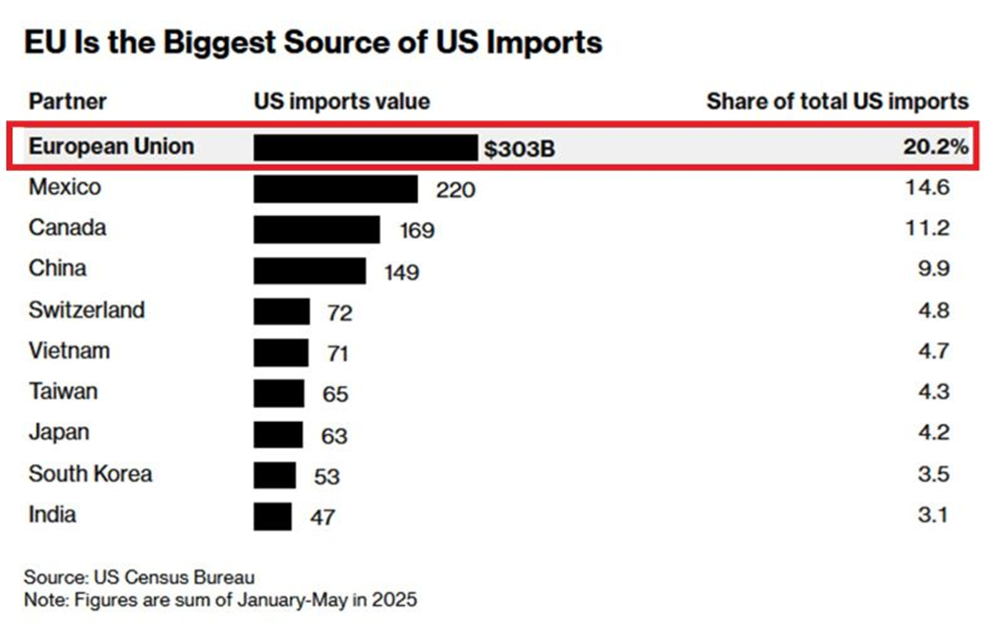
Chart #5 —
The EU is freezing its trade deal with the US
On Monday, the main political groups in the EU Parliament paused legislative work on ratifying the deal, awaiting clarification on Trump’s new tariffs.
The agreement has already faced challenges, as the US expanded its 50% metals tariff to hundreds of additional products and Trump threatened to annex Greenland.
The deal, reached last summer, would apply a 15% tariff on most EU exports to the US while lifting tariffs on US industrial goods.
Source: Bloomberg
Chart #6 —
China is indeed dumping US Treasuries
China’s holdings of US government bonds dropped $75.5bn in 2025 to $683.5bn, the lowest since September 2008, the Great Financial Crisis.
China has sold $350.3bn since 2022.
Since the 2013 peak, holdings have fallen $633.2bn.
Meanwhile, the rise in Treasury holdings in Belgium or Luxembourg is not China hiding its bonds offshore, but global banks moving out of the increasingly illiquid and over-regulated US market.
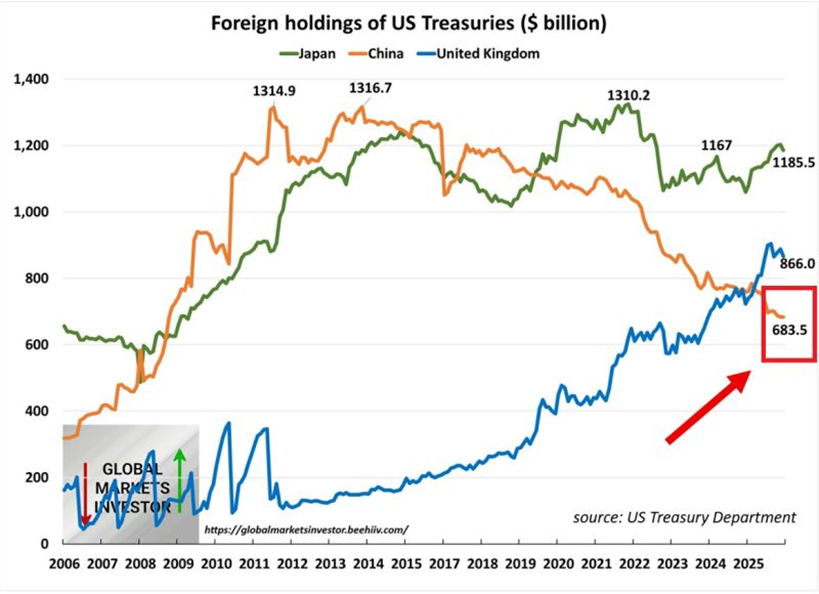
Source: Global Markets Investor
Chart #7 —
Global debt is surging as governments ramp up spending on national security and economic resilience
Global debt grew by nearly $29tr in 2025, bringing the total to a record $348tr, according to the IIF.
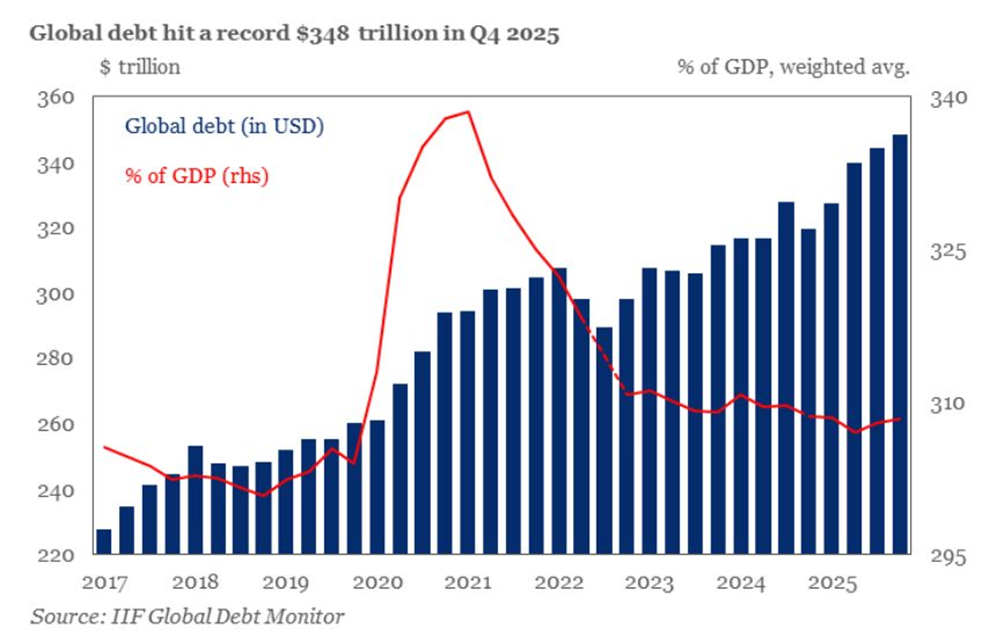
Source: Global Markets Investor, IIF
Disclaimer
This marketing document has been issued by Bank Syz Ltd. It is not intended for distribution to, publication, provision or use by individuals or legal entities that are citizens of or reside in a state, country or jurisdiction in which applicable laws and regulations prohibit its distribution, publication, provision or use. It is not directed to any person or entity to whom it would be illegal to send such marketing material. This document is intended for informational purposes only and should not be construed as an offer, solicitation or recommendation for the subscription, purchase, sale or safekeeping of any security or financial instrument or for the engagement in any other transaction, as the provision of any investment advice or service, or as a contractual document. Nothing in this document constitutes an investment, legal, tax or accounting advice or a representation that any investment or strategy is suitable or appropriate for an investor's particular and individual circumstances, nor does it constitute a personalized investment advice for any investor. This document reflects the information, opinions and comments of Bank Syz Ltd. as of the date of its publication, which are subject to change without notice. The opinions and comments of the authors in this document reflect their current views and may not coincide with those of other Syz Group entities or third parties, which may have reached different conclusions. The market valuations, terms and calculations contained herein are estimates only. The information provided comes from sources deemed reliable, but Bank Syz Ltd. does not guarantee its completeness, accuracy, reliability and actuality. Past performance gives no indication of nor guarantees current or future results. Bank Syz Ltd. accepts no liability for any loss arising from the use of this document.
Related Articles
Meanwhile, Wall Street's long-term earnings expectations for the S&P 500 are now at record levels. Each week, the Syz investment team takes you through the last seven days in seven charts.
Meanwhile, corporate leadership is evolving rapidly: only 135 of the S&P 500 constituents from 1996 are still in the index today, while the EU goods trade deficit with China is close to a record €376bn. Each week, the Syz investment team takes you through the last seven days in seven charts.
Meanwhile, Trump’s personal crypto earnings in 2025 topped the combined profits of every publicly listed US crypto company. Each week, the Syz investment team takes you through the last seven days in seven charts.