


.png)
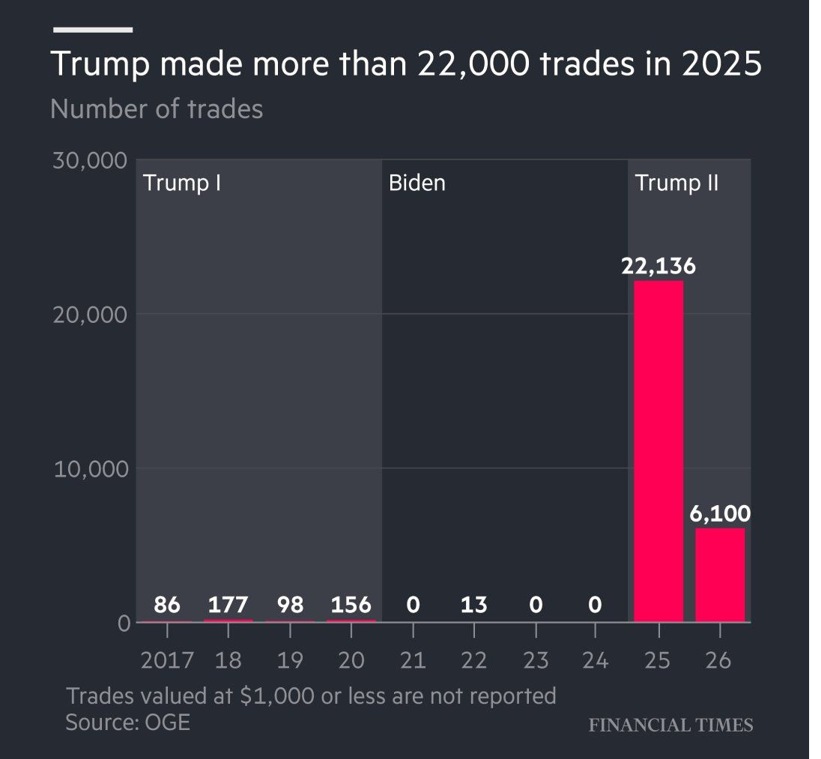 Source: FT
Chart #2 —
Pro-crypto president indeed...
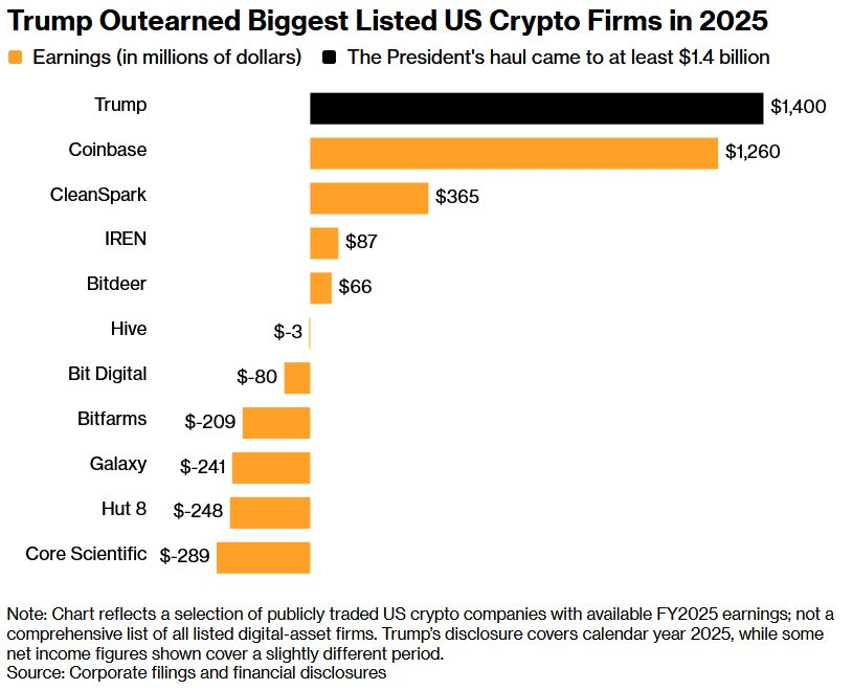
Trump personally earned more from crypto in 2025 than every publicly traded US crypto company combined, over $1.4bn, more than Coinbase's $1.26bn.
The breakdown:
- Trump meme coin: $635mn
- World Liberty Financial token sales: $526mn
- USD1 stablecoin venture divestment: $196mn
- Corporate share buyback and stake sale: $65mn
- Melania NFT business revenue: $6.01mn
- Ethereum validator staking rewards: $1.82mn
- Bitcoin, Ethereum, and USDC reserves: $125mn
 Source: Bloomberg, Bull Theory
Chart #3 —
The end of US exceptionalism? Really?
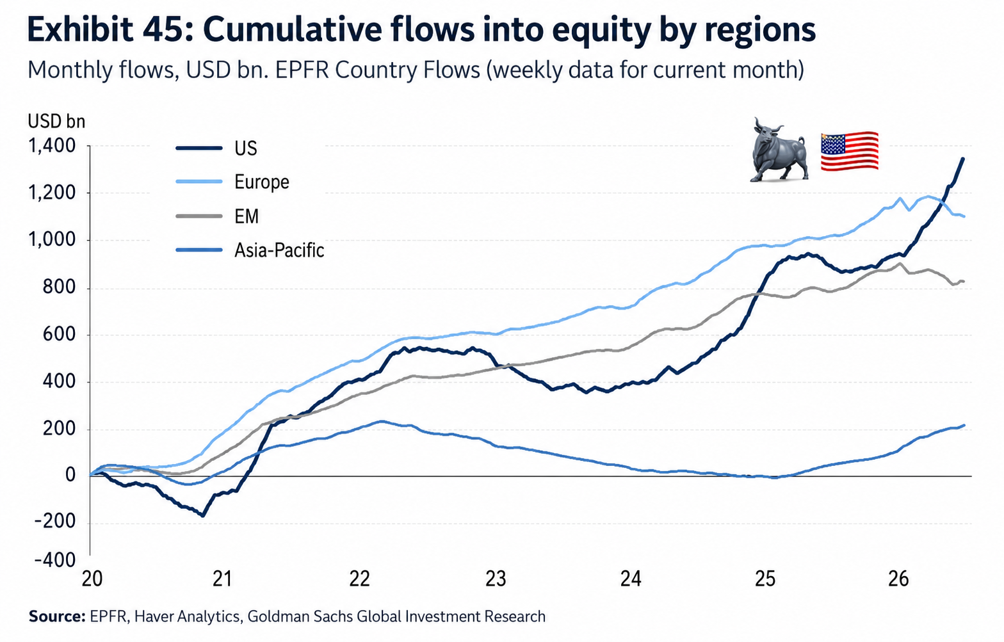
US equity funds and ETFs are seeing massive inflows again. Cumulative flows into the US have surged to roughly $1,350bn, overtaking Europe (~$1,100bn) after trailing it for much of the past two years.
 Source: EPFR, Goldman
Chart #4 —
The US labour market just sent its weakest signal in months
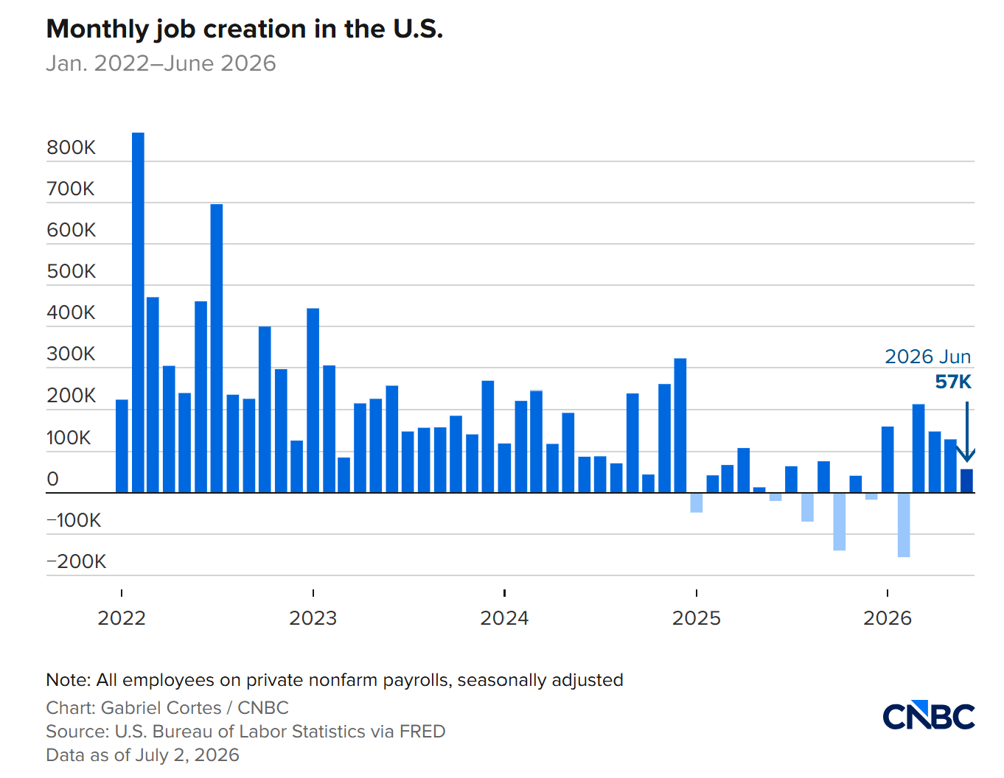
The US labour market sent its weakest signal in months, with nonfarm payrolls rising by just 57,000 in June, well below the 115,000 expected and a sharp slowdown from May's upwardly revised 129,000. While the unemployment rate edged down to 4.2%, the headline masked growing signs of weakness. Labour force participation fell to 61.5%, its lowest level since March 2021, and household employment declined by 507,000 in a single month.
Wage growth remained resilient, with average hourly earnings increasing 0.3% month-on-month and 3.5% year-on-year, suggesting inflationary pressures have yet to fully subside. Job gains were concentrated in professional and business services (+36,000), social assistance (+25,000), healthcare (+22,000) and government (+8,000), while leisure and hospitality unexpectedly lost 61,000 jobs despite expectations that the World Cup would support seasonal hiring.
Source: CNBC
Chart #5 —
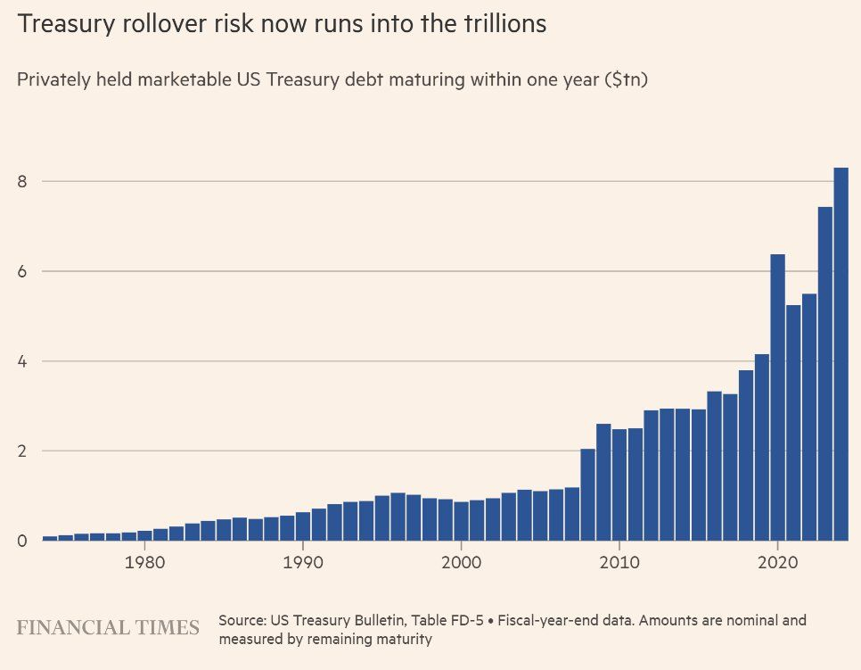
The US can't afford much higher interest rates—here's why
Within the next 12 months, the US Treasury needs to roll over close to $8tr in debt.
The average rate on that debt sits at roughly 3.3%. Right now, the 1-year Treasury yields about 4%. Refinancing that $8tr trillion at today's rates alone would add around $50bn to annual interest costs.
And that is before factoring in interest on a recurring $2tr yearly budget deficit.
This is what makes today's fiscal picture fundamentally different from the early 1980s.
When Paul Volcker pushed rates into double digits, the US had already spent years benefiting from high inflation that sharply shrank the debt burden relative to the size of the economy.
Today, debt levels are far higher. Each percentage point rise in borrowing costs weighs much more heavily on the federal budget. The Fed is not only battling inflation, but also working with one eye on a balance sheet that has grown increasingly sensitive to higher rates. The longer rates stay elevated, the costlier America's debt becomes.
 Source: Lukas Ekwueme, FT
Chart #6 —
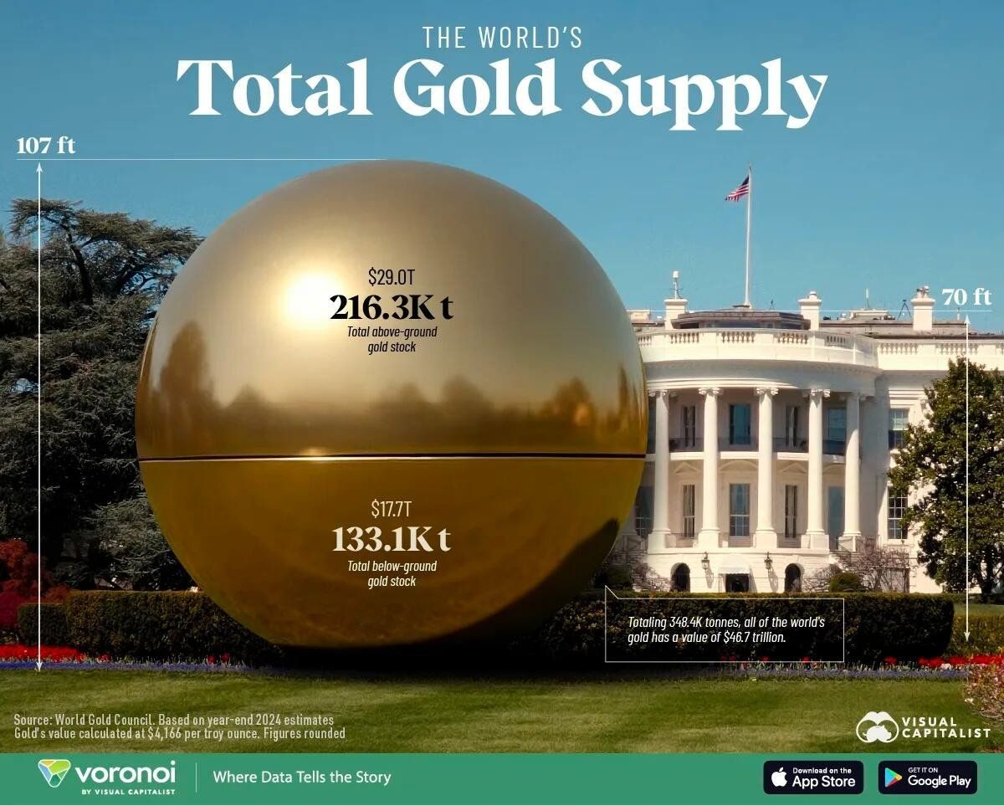
All the gold ever mined fits in a sphere close to the size of the White House
Based on the World Gold Council's estimate of about 216,300 tonnes of above-ground gold at the end of 2025, combined with gold's density of roughly 19.3 tonnes per cubic meter, all of it fit into a cube measuring around 22.5 meters on each side.
That is the entirety of the world's gold supply. It expands by roughly 2% a year, and no one can print more.
Source: Jack Prandelli on X, Visual Capitalist
Chart #7 —
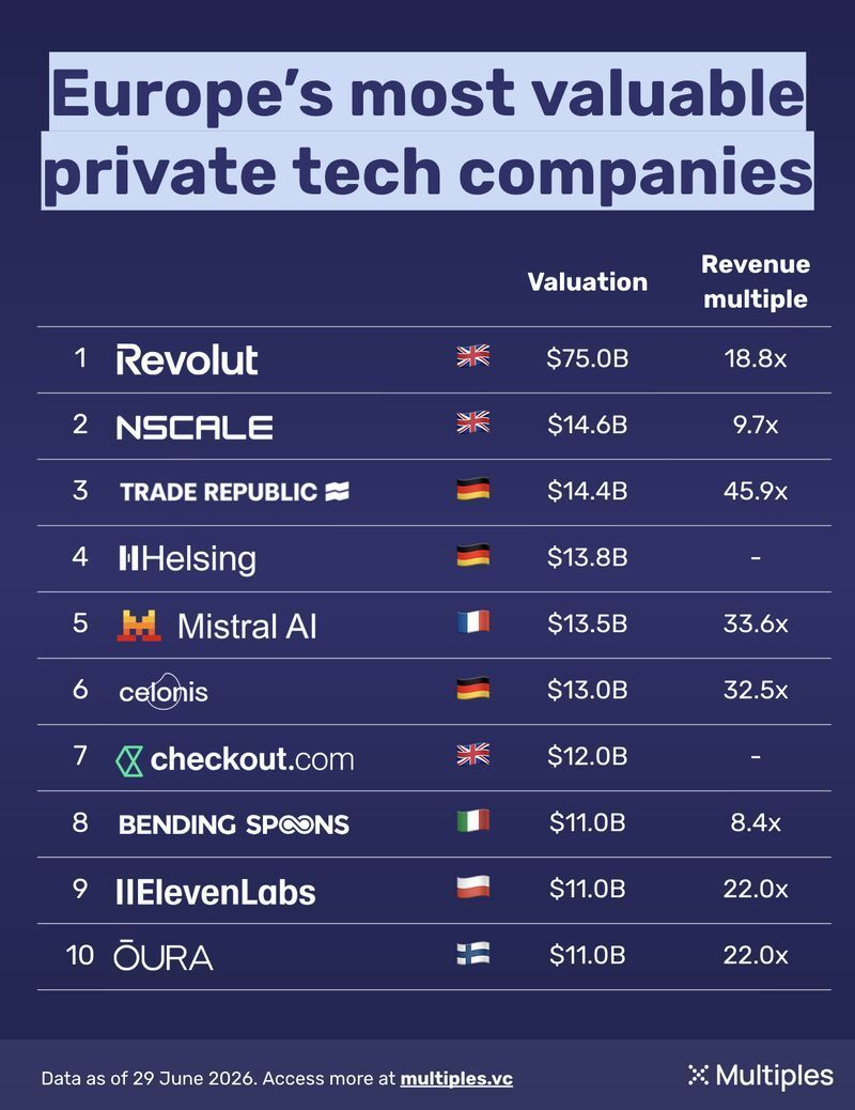
Europe’s most valuable private tech companies
Here are the top 10 most valuable European private tech firms still awaiting an IPO or acquisition, as of 29 June 2026.
 Source: Sebastiaan Vaessen, X Multiples
Disclaimer
This marketing document has been issued by Bank Syz Ltd. It is not intended for distribution to, publication, provision or use by individuals or legal entities that are citizens of or reside in a state, country or jurisdiction in which applicable laws and regulations prohibit its distribution, publication, provision or use. It is not directed to any person or entity to whom it would be illegal to send such marketing material. This document is intended for informational purposes only and should not be construed as an offer, solicitation or recommendation for the subscription, purchase, sale or safekeeping of any security or financial instrument or for the engagement in any other transaction, as the provision of any investment advice or service, or as a contractual document. Nothing in this document constitutes an investment, legal, tax or accounting advice or a representation that any investment or strategy is suitable or appropriate for an investor's particular and individual circumstances, nor does it constitute a personalized investment advice for any investor. This document reflects the information, opinions and comments of Bank Syz Ltd. as of the date of its publication, which are subject to change without notice. The opinions and comments of the authors in this document reflect their current views and may not coincide with those of other Syz Group entities or third parties, which may have reached different conclusions. The market valuations, terms and calculations contained herein are estimates only. The information provided comes from sources deemed reliable, but Bank Syz Ltd. does not guarantee its completeness, accuracy, reliability and actuality. Past performance gives no indication of nor guarantees current or future results. Bank Syz Ltd. accepts no liability for any loss arising from the use of this document.
Related Articles
Meanwhile, earnings growth, not valuation expansion, is doing the heavy lifting behind the S&P 500’s rally. Each week, the Syz investment team takes you through the last seven days in seven charts.
Meanwhile, what does Anthropic’s $2tn valuation assume about future growth? Each week, the Syz investment team takes you through the last seven days in seven charts.
Meanwhile, US earnings growth leaves the rest of the world behind. Each week, the Syz investment team takes you through the last seven days in seven charts.