


.png)
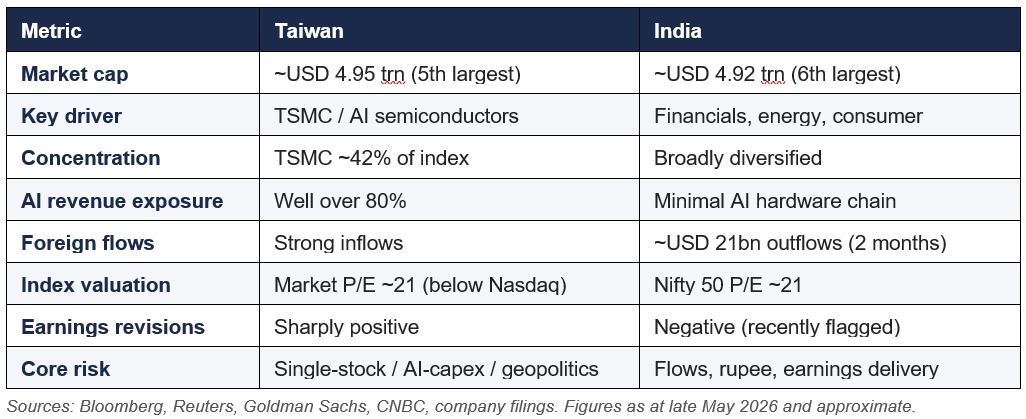
For the first time, Taiwan has become the world’s fifth-largest equity market. Its market capitalisation reached USD 4.95 trillion, edging past India’s USD 4.92 trillion, placing it behind only the United States, mainland China, Japan and Hong Kong. The striking part is the economic mismatch: Taiwan achieved this despite an economy roughly four times smaller than India’s. This is a story about market structure and capital flows — not relative economic size.
Why Taiwan is outperforming
It comes down to one word — and almost one company. Taiwan’s ascent is overwhelmingly driven by TSMC, which now represents around 42% of the benchmark index and whose shares have rallied close to 46–49% year-to-date on the AI trade, where its semiconductors hold a dominant position.
The deeper driver is global capital chasing the AI hardware theme, and Taiwan is the purest expression of it — the market is estimated to be well over 80% exposed to AI-related revenue. TSMC sits at the chokepoint of the supply chain: in Q1 2026, high-performance computing made up about 61% of wafer revenue and advanced nodes (7nm and below) around 74%. Critically, it is a toll-booth that wins regardless of which chip designer prevails — Nvidia, Google, AMD or others all depend on it.
The fundamentals have followed the narrative. TSMC reported Q1 2026 revenue of USD 35.9bn, up 35% year-on-year, with gross margin of 66.2% beating guidance, and management raised full-year 2026 revenue guidance to above 30% growth. This is a rally underpinned by delivered earnings, not pure speculation.
Why India is lagging
India’s weakness is partly relative — it lacks the AI exposure pulling capital elsewhere — and partly its own macro story. The capital exodus has been severe:
- Record outflows. Foreign investors withdrew roughly USD 21bn over two months, putting 2026 on track for the worst year of outflows since India opened to overseas investment in 1993 — with much of that capital redirected to Taiwan and South Korea.
- No AI value chain. The absence of a meaningful AI hardware exporter in most Indian companies has driven the reallocation, as global capital chases the next technology cycle.
- Macro headwinds. A stronger US dollar, higher global yields, elevated crude prices (Middle East risk) and rupee weakness have left Indian equities exposed to broad emerging-market de-risking.
- Valuation and earnings. The Nifty 50 still trades near 21x earnings, demanding visible earnings upgrades to justify its premium. India was recently flagged as the only major market with significant negative earnings revisions over a three-month window.
Taiwan vs. India — at a glance
Can Taiwan keep performing? The outlook
The bull case is intact for now. AI accelerator revenue at TSMC is tracking a mid-to-high-50s percent CAGR through 2029. And 2026 capex is guided toward the top of the USD 52–56bn range.
But the risks are concentrated and correlated:
- Single-stock dependency. With TSMC at ~42% of the index, Taiwan’s ranking is effectively a leveraged bet on one company. The “one-trick pony” critique is a genuine structural vulnerability.
- AI-capex cliff. With HPC (High Power Computing) at 61% of TSMC revenue, any pause in hyperscaler spending hits the company — and the index — evenly.
- Geopolitics. Cross-strait risk remains the perennial, unhedgeable overhang, with even saber-rattling has historically triggered sharp selloffs.
- Energy import sensitivity. Taiwan sits on the wrong side of the terms of trade as a large energy importer — higher oil prices can erode competitiveness even as AI demand lifts exports.
Are Taiwan tech stocks in a bubble?
The answer is more nuanced than the rally suggests: at the index level, valuations do not look bubbly — the risk is concentration and embedded expectations, not raw multiples.
Against the bubble thesis: Taiwan’s market P/E is around 21 — below both the Nasdaq and the Nikkei — remarkable for a market this AI-levered. TSMC itself trades near 34x trailing earnings, with a P/E still below pure-play AI peers such as Nvidia and AMD. The earnings are real and growing 30%+, so the multiple is supported by delivered fundamentals.
For caution: the danger is not the multiple, but what happens if growth breaks. A stock at 34x growing 25%+ is reasonable; the same stock is expensive if growth decelerates to 15%. The “bubble” question is therefore a bet on the durability of the AI capex cycle. If hyperscaler spending flattens, TSMC, the index and Taiwan’s global ranking re-rate downward together.
Synthesis. Taiwan tech is best characterised as priced for continued AI strength but not in obvious bubble territory by valuation. The fragility lies in concentration — one stock, one theme — and in fundamentals and sentiment pointing the same way, which works beautifully on the way up and painfully on the way down. For an allocator, the more useful framing than “bubble or not” is that this is a high-quality, high-conviction, low-diversification exposure whose dominant risks are correlated and hard to hedge.
A contrarian footnote on India
The same data supports an opposite trade. India’s underperformance and record outflows, paired with a valuation reset and an expected earnings recovery, is precisely the setup that has historically preceded mean reversion — several strategists expect foreign flows to turn sustainably positive as 2026 earnings pick up. When a divergence becomes this sharp, the more interesting long-horizon opportunity may be the unloved laggard rather than the crowded winner.