The US acceleration is in the components
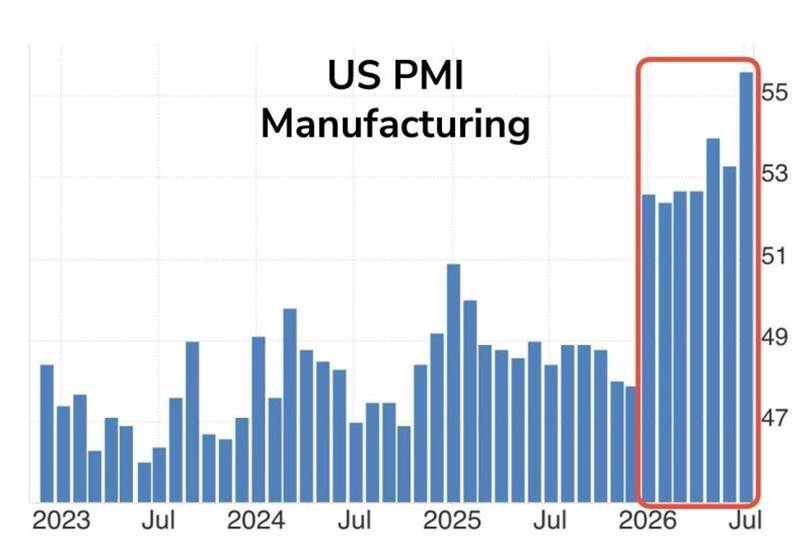
ISM Manufacturing PMI came in at 55.6 for July, against expectations of 54.0. This is the highest level in 4 years. And the 7th straight month of expansion…
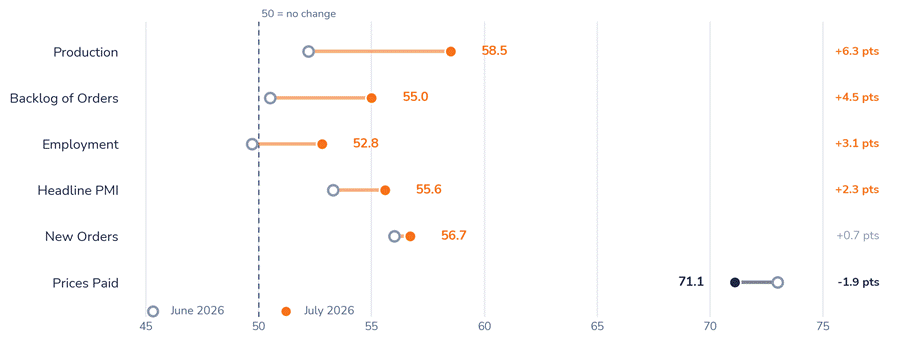
Chart 1 · US ISM Manufacturing — Sub-Index Detail, June vs July 2026
But the ISM composition matters even more than the headline. Indeed, production rose 6.3 points to 58.5, the highest since November 2021, and backlogs jumped 4.5 points to 55.0 — demand is outpacing capacity, not merely refilling order books. The critical line is employment: at 52.8, up 3.1 points, it entered expansion for the first time in thirty-three months. Manufacturers do not add headcount on a one-month fluke. Customers’ inventories at 40.7 remain “too low”, historically a positive lead for production.
Two qualifications. The parallel S&P Global US survey held flat at 53.8 and warned that its headline masks softer production; the direction of travel is agreed, the amplitude is not. But its US composite reached 53.6, an eight-month high. ISM services, out this afternoon against 54.0 in June, is the confirmation to watch.
Chart 2 · US ISM Manufacturing — Sub-Index Detail, June vs July 2026
Diffusion indices · 50 = no change on the prior month · Prices Paid shown on the same scale
Breadth: Japan and Europe join, China does not
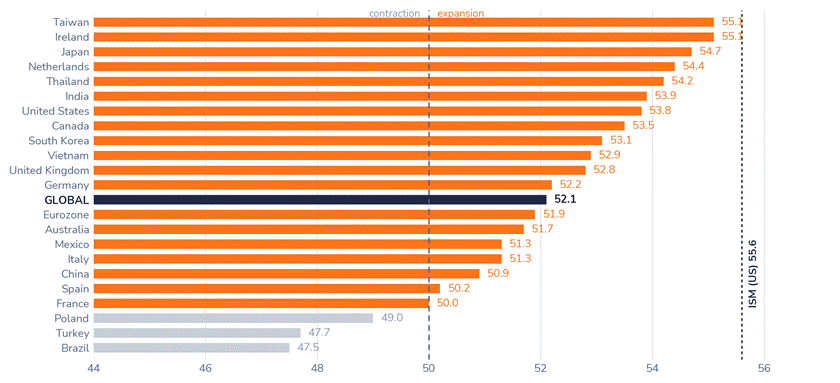
The global manufacturing PMI printed 52.1, a four-month low but an eighth month above 50; the softening in the aggregate is largely Chinese arithmetic. Japan is the developed-world standout, with new orders at their steepest in four and a half years on AI-related demand. The Eurozone composite rose to 52.0 from 50.0, the fastest in eight months, with Germany back above 50 and input cost inflation at its weakest since February. Taiwan at 55.1, Korea at 53.1, and Vietnam at 52.9 confirm the export channel is open.
China diverges. The official NBS index fell 1.1 points to 49.2, a second month of contraction, with services at 49.0; the private RatingDog survey held at 50.9 but hit a four-month low. Private exporters remain in the global cycle; the domestic industrial base does not. Express the EM goods cycle through ASEAN, Mexico and North Asian exporters.
Table 1 · July 2026 PMI Summary — Major Economies
S&P Global PMIs unless stated · *ISM Manufacturing PMI, not directly comparable with the S&P Global US series
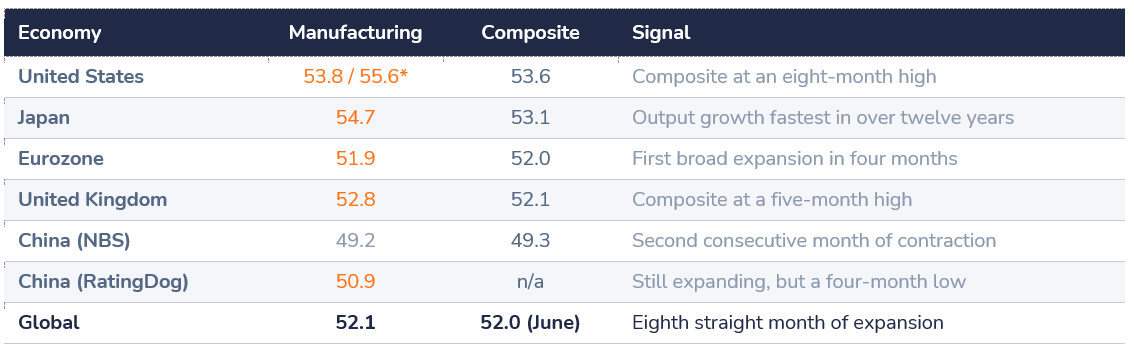
Chart 3 · Manufacturing PMI by Economy — July 2026
Selected economies · S&P Global manufacturing PMIs · dashed line at 50 separates expansion from contraction
Is good news still good news for equities?
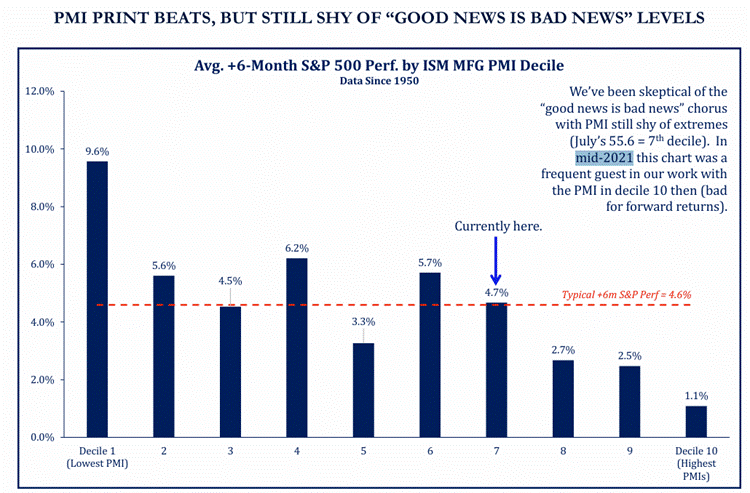
Chart 4, courtesy of Strategas, maps the average subsequent six-month S&P 500 return against the ISM decile since 1950. July’s 55.6 falls in the seventh decile, where the average forward return has been 4.7% against an unconditional 4.6%. The strongest returns cluster in the first decile (9.6%); the weakest in deciles eight to ten (2.7%, 2.5% and 1.1%). The “good news is bad news” argument is therefore premature by roughly two deciles: at 55.6 the ISM sits in the flat middle, where the activity level carries essentially no information about forward returns.
Chart 4 · Average Subsequent 6-Month S&P 500 Performance by ISM Manufacturing PMI Decile
Data since 1950 · July 2026 ISM at 55.6 sits in the seventh decile · unconditional average +6m performance = 4.6%
Source: Strategas
Three caveats: overlapping windows shrink the effective sample; the ISM has drifted structurally lower as the economy has become more services-weighted; and the mapping is unconditional on the monetary regime.
The constraint is prices, but inflation is also the numerator
ISM prices paid registered 71.1, a sixth month above 70. The Fed held on 29 July with three dissents for a hike; swaps price roughly 60% odds of a September increase, December is fully discounted, and the thirty-year US Treasury yield is at its highest since 2007. A strong ISM therefore transmits through the discount rate, not only through earnings. That is the legitimate core of the bearish case.
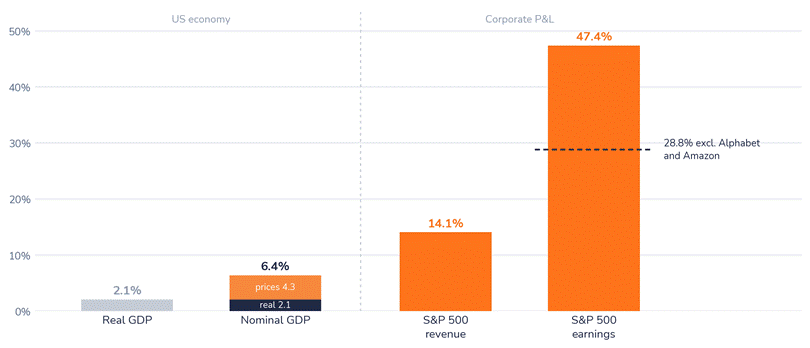
But equities are nominal claims. Real GDP grew 2.1% year-on-year, a number that reads as a stall. while the deflator rose 4.3%, putting nominal GDP at 6.4%. That arrives intact in the accounts: S&P 500 revenue growth of 14.1%, the fastest since Q2 2022; blended earnings growth of 47.4%, still 28.8% excluding Alphabet and Amazon; and a net margin of 16.7% against 12.9% a year ago. Margins expanding while input costs rise for a twenty-second month is the pricing-power test, and it is being passed.
Chart 5 · Real versus nominal – where the growth is, Q2 2026
Year-on-year growth · GDP from BEA advance estimate, 30 July 2026 · S&P 500 blended growth rates as at 4 August 2026
The relationship is not monotonic. Earnings capture nominal growth; the multiple pays for inflation, and the earnings channel dominates while inflation runs roughly between 2% and 4%. Core PCE at 3.4% annualised sits at the upper edge of that zone; headline at 5.1% does not. With the forward P/E near 21 against a ten-year average of 18.9, there is limited room for further compression. This is a reason to own equities rather than bonds, not a reason to pay more for them.
Investment conclusions
- While interest rates and bond yields might stay higher for longer, the backdrop remains supportive: economic growth is resilient, the labor market remains healthy, and S&P 500 earnings are on track to grow by more than 27% this year.
- We maintain our preference for equities over fixed income. We are neutral on hedge funds and overweight commodities & gold, as diversifiers. We are overweight the dollar against all currencies expect the yen, where we are neutral.
- The AI investment cycle remains a powerful structural theme, but stock selection is becoming increasingly important. Staying diversified and focused on long-term opportunities remains the best approach amid ongoing policy and geopolitical uncertainty.



.png)