-


Key takeaways

  • Despite geopolitical uncertainty reaching record highs, global equity markets remain resilient, with stocks—led by international markets—continuing to outperform fixed income. Market leadership remains rotational, favouring “old economy” sectors such as Materials, Energy, Consumer Staples, and Utilities, while Communications and Technology lag.
  • The US Supreme Court’s decision to invalidate IEEPA-based tariffs and the administration’s swift response via Section 122 were largely anticipated, helping to ease concerns around unexpected policy disruption.
  • Against this backdrop of solid economic and earnings fundamentals, a diversified and fully invested stance remains appropriate. The preferred positioning includes an overweight to equities, particularly emerging markets, selective opportunities in US mid-cap and value stocks, continued exposure to gold, commodities, and hedge funds as diversifiers, an underweight in Fixed Income, and a neutral view on the dollar.

THE BIG PICTURE

Tariff policy and the Supreme Court's ruling against Trump's broad reciprocal tariffs have created volatility during the month of February. The US and Iran’s nuclear negotiations have swung between supporting and reducing risk premiums on oil and gold. AI capital expenditure scepticism has weighed on US mega-cap tech. Meanwhile, a weaker dollar, strong central bank gold buying, and geopolitical uncertainty have kept commodities—especially gold—very well supported even after January's sharp correction.

Equities

US stocks had a choppy February, with the S&P 500 hovering around 6,900 as of 26 February—roughly flat for the month and up only modestly year-to-date, ending January at around 6,800 after a shifting +1.4% January. The S&P 500 is down about 1% over the past month, while the Nasdaq 100 dropped nearly 2%. These choppy conditions took place despite underlying corporate fundamentals remaining strong: as of 26 February, the S&P 500 is tracking a blended earnings growth rate of 13.2% for Q4 2025—its fifth consecutive quarter of double-digit earnings growth—with 74% of companies beating EPS estimates.

The big story has been AI and tech, where the mood has turned more cautious. Nvidia beat earnings expectations, but its stock still fell 5%. This shows that investors are closely scrutinising tech companies because they are worried that spending on AI infrastructure may have been overstated. Amazon was another notable laggard, down nearly 13% year-to-date after reporting it expects to spend $200bn in capex this year—nearly 60% more than last year and well above Wall Street's forecasts.

One of the main stories within global markets has been the brutal selloff of stocks whose business model is at risk of being disrupted by AI. This has been especially evident in the recent selloff in the software sector, which has tumbled over the last few weeks amid a convergence of legitimate long-term uncertainty about AI’s role in enterprise workflows and a valuation reset that was arguably overdue after two years of extraordinary gains. The immediate trigger for the software selloff was Anthropic's rollout of new AI-powered Cowork plugins for its Claude model, which automate workflows across legal, finance, sales, and marketing—wiping roughly $1tr in market value from the software sector. In recent weeks, Anthropic also released Claude Code Security, which scans codebases for vulnerabilities and suggests software patches, hitting cybersecurity names too. The market's reaction was swift and broad. Adobe, Salesforce, and ServiceNow have all slid roughly 25% to 30%. Intuit has fared even worse, falling more than 34% year-to-date after dropping nearly 11% in a single session. In Europe, the pain spread globally: the Stoxx Europe Software and Computer Services index dropped more than 5% in one session, with RELX losing more than 14%, and Capgemini even lower. Gartner, the IT consulting firm, saw its stock fall 30% after forecasting zero revenue growth in 2026 due to a "much tougher selling environment."

So, is the fear justified? The interesting part is that most of these companies are still reporting solid results. It should also be noted that the selloff has been indiscriminate, hitting stocks that could benefit from AI. The truth likely lies somewhere in between: AI will disrupt some business models, while for others it will ultimately be a growth driver. For now, the market appears to be broadly pricing in a worst-case scenario.

All told, the derating of “Mag 7” stocks and the sharp selloff across software and IT have heavily weighed on the Technology & Communications sector. In contrast, traditional “old economy” industries—such as Oil, Materials, and Consumer Staples—have emerged as relative outperformers. Wall Street has even coined a new acronym, HALO (Heavy Assets, Low Obsolescence), to describe the key traits investors are prioritising in stock selection for 2026.

Outside of the US, the picture has been considerably brighter. The S&P 500 has trailed both developed and emerging markets, continuing 2025’s trend that extended into early 2026. Japan's Nikkei 225 crossed 59,000 for the first time as the Takaichi trade gained momentum, while European indices have broadly advanced. In Asia, Korea’s KOSPI remains the star index with gains close to 150% year-to-date, driven mainly by memory chips stocks.

Fixed Income

US rates and credit markets have shown interesting developments lately as investors reassess growth prospects and the implications of the AI-driven capex cycle.

The US 10-year Treasury yield has traded between 4-4.3% since last August and is back again to the low end of its range. Softer retail sales, easing inflation, and hints of productivity-driven deflationary pressures have driven USD yields lower, with markets again pricing the possibility of additional Fed rate cuts.

However, support remains fiscal stimulus from the Big Beautiful Bill, lower gasoline prices, and the ongoing AI capex wave should underpin consumption and GDP growth. As a result, the 4% level appears to be a significant threshold and potential bottom, unless data further deteriorates or inflation significantly slows down.

In credit, spreads have widened moderately from January’s tight levels, returning toward December averages in both Investment Grade and High Yield. The move is led by the Technology sector, at the heart of the AI transition. The High Yield Technology sector has been underperforming the broad HY market since November, with spreads widening sharply since mid-January even as the broader market remains historically tight. In Investment Grade, the shift is more structural: after years of trading at tighter spreads than the overall market, Technology sector corporate spreads have gradually moved toward the IG market average level following heavy AI-related debt issuance. In February, they rose above the broader IG average for the first time in two decades.

Overall, AI is simultaneously supporting macro growth, potentially lowering inflation dynamics, and reshaping credit market equilibria, particularly within Technology. Upcoming data on employment, growth and inflation will be decisive for the near-term direction of US rates and the evolution of credit spreads.

Commodities

Commodities have been the most volatile asset class in February. Gold had an extraordinary January as prices rallied nearly $1,300 (+29%) intramonth to approach $5,600 per ounce before reversing sharply late in the month. The pullback followed President Trump’s nomination of Kevin Warsh as the next Fed Chair, a move markets interpreted as posing less of a threat to Federal Reserve independence than initially feared. Gold fell more than 9% in a single day in late January—its sharpest one-day drop since 1983—before recovering throughout February. Gold reached its all-time high of $5,595 on 29 January before stabilising around $5,210 by the end of February, up enormously year-over-year—roughly +74% versus a year ago. Gold wrapped up its third consecutive weekly gain in the final week of February, benefiting from US dollar weakness and tariff uncertainty.

Oil has also been active. WTI crude surged 22% to a six-month high as US and Iran tensions escalated, though prices eased somewhat after progress in nuclear talks. Brent crude was trading near $67.50/barrel in mid-February as geopolitical risks ebbed and flowed.

Forex

The US dollar has continued to weaken in 2026, extending the downtrend from 2025. The dollar index has fallen about 1.2% so far this year, following a decline of more than 9% last year. The Chinese yuan has been notably strong, climbing to its highest level against the dollar in nearly three years. The Japanese yen has been volatile: hawkish signals from the Bank of Japan have provided intermittent support, while growth concerns have triggered occasional weakness. Meanwhile, the euro has remained relatively stable, with EUR/USD hovering around 1.08.

Our take on the SCOTUS tariff ruling: what happened and what it means

On 20 February 2026, the US Supreme Court struck down the core of President Trump's tariff agenda in a 6-3 ruling, determining that the administration had exceeded its authority under the International Emergency Economic Powers Act (IEEPA). The Court's key argument was that IEEPA—a law from 1977 designed to regulate commerce during declared national emergencies—never explicitly grants the power to impose tariffs, a power that constitutionally belongs to Congress. The ruling targeted both the trafficking tariffs on China, Canada, and Mexico, justified by the fentanyl problem, and the broad reciprocal tariffs applied to nearly all trading partners on the basis of trade deficits. These IEEPA-based tariffs had accounted for roughly 60% of total US tariff collections, equalling about $133bn.

The administration's response

The White House anticipated this outcome and moved swiftly. It deployed a two-step strategy. First, it immediately invoked Section 122 of the Trade Act of 1974 to impose a 15% blanket tariff on all trading partners—a temporary measure that can remain in place for only 150 days before requiring Congressional approval, putting a deadline of late July 2026 on the clock. Second, and in parallel, the administration plans to use Sections 232 (national security) and 301 (unfair trade practices) to build more legally durable, country-by-country tariff frameworks over time, though these take significantly longer to implement.

The new tariff landscape: winners and losers

The switch to a flat 15% rate creates an unexpected redistribution of tariff burden. Countries that previously faced the highest targeted rates, such as Brazil (-13.6%), China (-7.1%), India (-5.6%), and Southeast Asian exporters like Vietnam and Thailand, actually see their effective tariff burden fall. Conversely, several US allies that previously enjoyed lower rates now face higher burdens: the UK's trade-weighted tariff rate increases by 2.1%, Italy's by 1.7%, and Singapore's by 1.1%. The overall trade-weighted average US tariff rate now sits at 13.2%, down slightly from 15.3% pre-ruling.

Market and macro implications

The authors' conclusion is measured: do not overestimate the tariff narrative. The $133bn in IEEPA tariff revenue is only around 0.45% of the $30tr US economy, inflationary effects have been contained, and the 2025 trade deficit barely moved despite tariff activity ($901.5bn vs. $903bn in 2024). US growth remains near trend and corporate earnings are projected to grow at a double-digit pace in 2026.

For markets, the most important consequence of the ruling is the reduction in policy uncertainty. The removal of IEEPA authority makes it structurally harder for any president to announce sudden, sweeping tariff hikes, like last year's Liberation Day measures. Future tariff changes are likely to be smaller, more gradual and more predictable, which markets generally welcome. The ruling also reinforces the rule of law, which could attract foreign capital and support asset prices, though the net dollar effect is ambiguous—lower tariffs could weigh on the currency, while institutional confidence could drive inflows.

The near-term risk is that the 150-day Section 122 window creates uncertainty over what will replace it and completing Section 301 investigations within that timeframe will be challenging. However, the overlap with the midterm election cycle makes a materially higher tariff escalation politically unlikely.

The bottom line: the tariff story is not over, but its most disruptive chapter probably is.

Focus on Q4 earnings season

Earnings performance remains robust across the S&P 500, underscoring continued corporate strength. With 85% of companies having already reported, blended year-over-year earnings growth stands at 13.2%, improving substantially from 11.9% just a month ago. This marks the fifth consecutive quarter of double-digit earnings growth for the index.

While 74% of companies have exceeded EPS expectations—slightly below the 5-year (78%) and 10-year (76%) averages—the size of the beats remains solid. Companies that surpassed estimates did so by an average of 7.2%, broadly in line with long-term norms. Earnings growth has been led by Information Technology, Industrials, and Communication Services, while Energy and Consumer Discretionary continue to post the steepest year-over-year declines.

Revenue trends also remain supportive. Blended revenue growth for Q4 2025 has strengthened to 9.0%, up from 8.2% a month earlier, extending the streak to 21 consecutive quarters of year-over-year revenue growth. Ten of the eleven sectors are reporting higher revenues, with Information Technology (20.6%) and Communication Services (12.2%) leading the advance. Energy remains the sole sector experiencing a revenue contraction.

Looking ahead, analyst expectations remain constructive. Earnings growth for 2026 is projected at 11.1% in Q1, 14.9% in Q2, and 14.4% for the full year, pointing to continued momentum. That said, valuations remain elevated: the forward 12-month P/E ratio stands at 21.5x. Although down from 22.2x a month ago, it is still well above the 5-year average of 20.0x and the 10-year average of 18.8x, suggesting markets continue to price in a favourable earnings outlook.


Indicators review summary - our five pillars

Our asset allocation preferences are based on 5 indicators, including 4 macro and fundamental indicators (leading) and 1 market dynamics (coincident). The weight of the evidence suggests a constructive view on equities (positive). Below we review the main drivers for each of them.


THE WEIGHT OF THE EVIDENCE

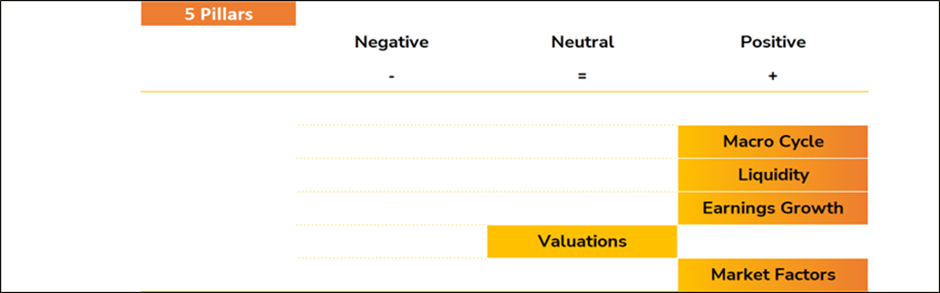
•   Macro cycle (POSITIVE): Domestic fiscal stimulus should provide economic support in the US, China, and Eurozone. Trade uncertainties have recently deescalated and macroeconomic data has improved. In the US, macroeconomic data came in stronger than expected, building on an already solid level of economic activity, apart from the labour market.  The latest labour market data were reassuring and exceeded consensus, while consumption now-casting indicators point to a rebound at the start of 2026 following the weak December retail print. In Europe, signs of economic recovery are finally appearing in hard macro data, including rising domestic orders and improvements in labor and housing market indicators. In China, domestic consumption remains weak, but the announced cancellation of the rigid 3 red lines” framework for deleveraging the property sector should lift sentiment real estate. Government programs to support domestic demand in the service sector have also just begun. On the industrial side, China’s anti-overcapacity campaign continues to weigh on business sentiment. Meanwhile, the latest figures from Asian emerging markets point to a recovery in the global manufacturing cycle, which is promising for emerging economies more broadly. These developments support our current positive macro assessment, although we continue to monitor elevated geopolitical risks and the likely end of the global central banks’ rate cutting cycle in 2026.  

•   Liquidity (POSITIVE): liquidity conditions for financial markets remain positive overall. The Fed has ended Quantitative Tightening and is purchasing Treasury bills to ease short-term funding conditions. Continuing global M2 growth and the US dollar’s softness contribute to a supportive liquidity environment for Q1.
  Earnings (POSITIVE): earnings remain a tailwind for equities with more sectors to show earnings growth improvement. Technology stocks will continue to benefit from the adoption of AI, while the “old economy” is set to recover from a low base.
•   Valuations (NEUTRAL): US large capitalisation stocks remain expensive while international equities are more reasonably valued. However, equity risk premiums remain low by historical standard in both the US and Europe.
•   Market Factors (POSITIVE): symphony indicators are positive at 75% allocation to equities (50% US / 25% EU).

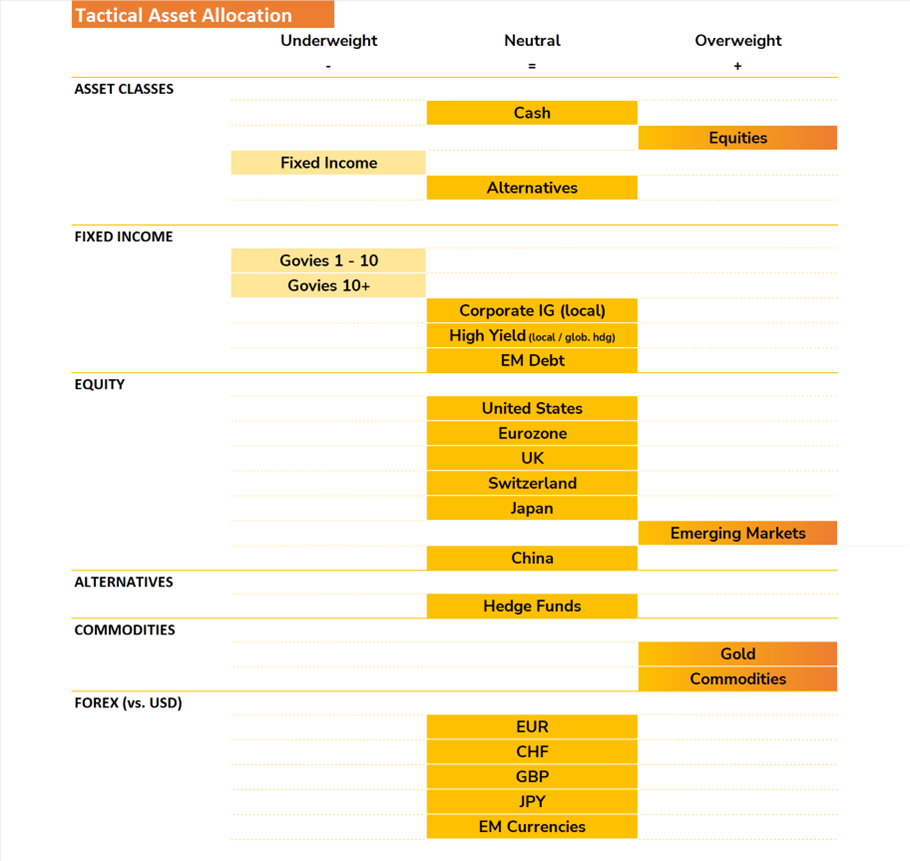
TACTICAL ASSET ALLOCATION (TAA) DECISIONS 

The weight of the evidence lead us to keep an overweight stance on equities. Within our asset allocation grids, we are aligning the weights with the recent market drift, leading us to reducing US Equities while increasing the allocation to Emerging Markets equities.

Indeed, while we keep a large allocation to US stocks, we find value outside the US. The shift from US to international markets that started in Q2 of 2025 seems to be gaining momentum, as shown in the chart below. 
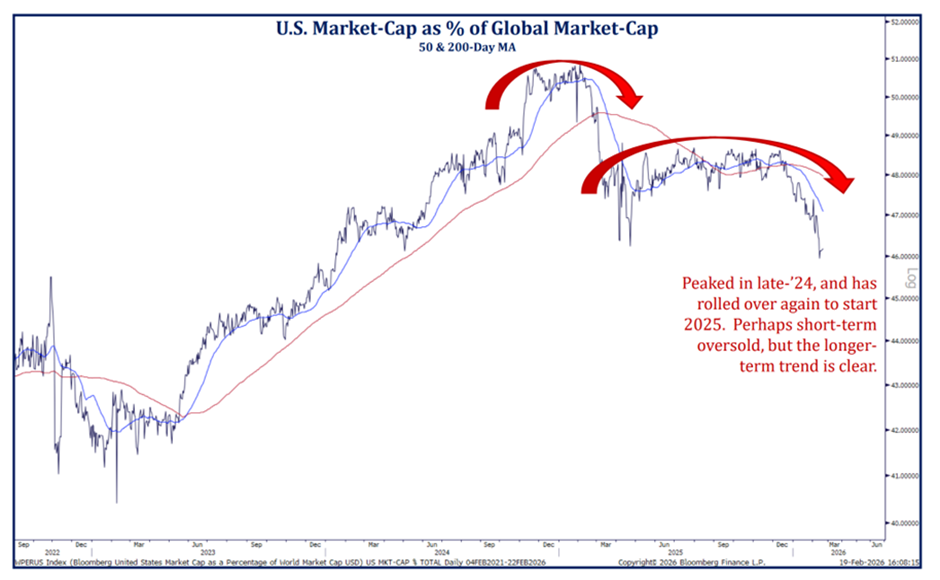
Source: Strategas

According to Bank of America, we have seen a record 4-week inflow of $64.6bn, mostly Korea (memory stonks) and Japan (reflation narrative).

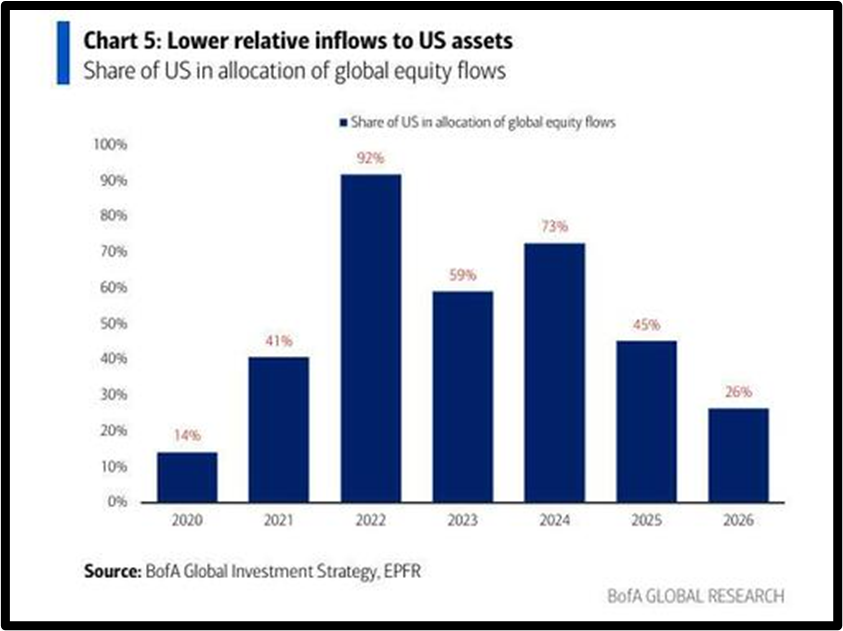
Looking at the Big Flow to Know, BofA calculated that in 2026, for every $100 of inflows to global equity funds, US stocks have accounted for $26—their lowest share since 2020.

Although global markets have narrowed the gap with the US in recent weeks, US equities still trade at a roughly 40% valuation premium to the rest of the world. That premium could shrink further if big tech companies lose their capital-light appeal due to rising capex and begin to be valued more like capital-intensive businesses.
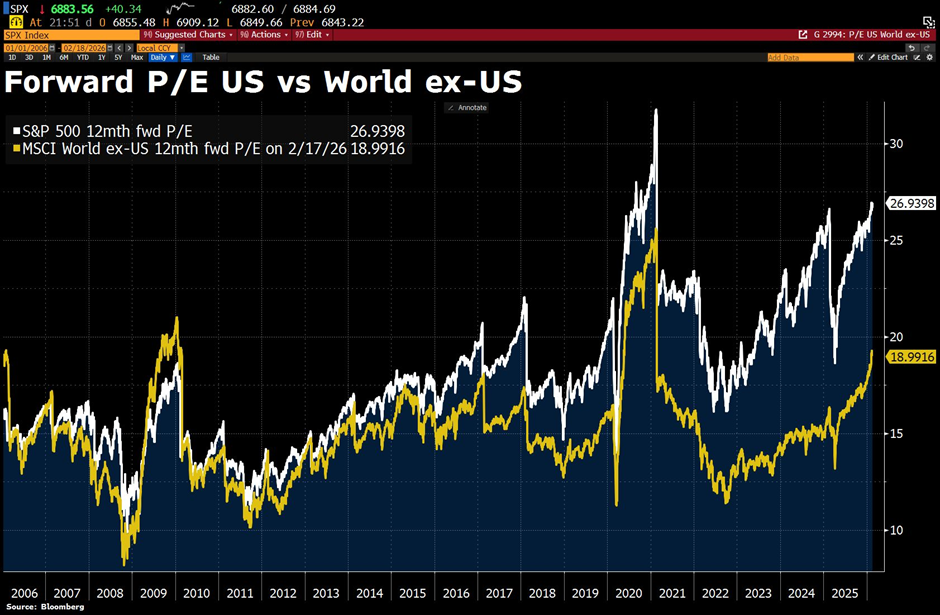
Source: Bloomberg

From a macro perspective, Emerging Markets and Asia are currently the most compelling regions in our perspective. Aggregate valuations remain compelling and earnings growth expectations are accelerating.

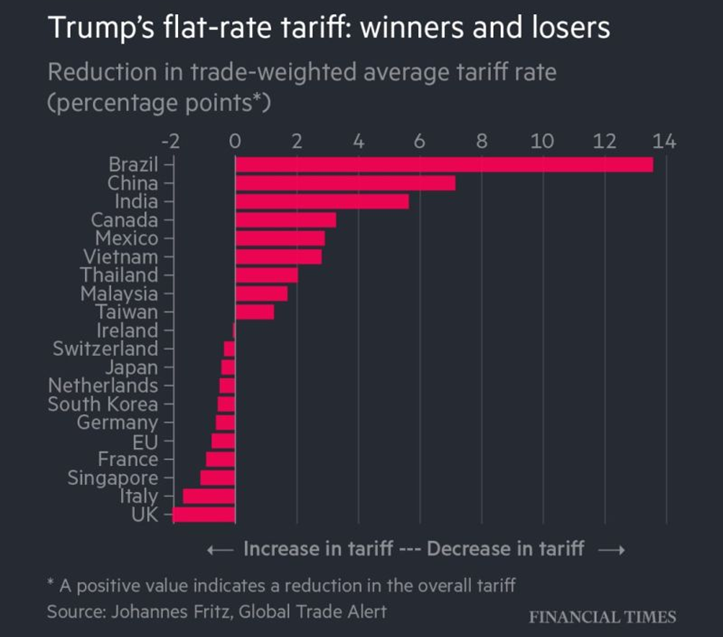
Emerging countries are the beneficiaries of the new 15% tariffs. According to new analysis from Global Trade Alert, the very countries frequently singled out for criticism are set to see their average tariff rates drop the most:

  • Brazil: enjoying a massive 13.6% reduction in average tariff rates
  • China: seeing a 7.1% reduction
  • India: seeing a 5.6% reduction
  • Vietnam, Thailand, & Malaysia: set to benefit significantly as previous specific levies are replaced by the blanket rate

In alternatives, we stay overweight gold and overweight commodities.

We stay neutral hedge funds.

We currently maintain an overall underweight stance on Fixed Income, due to a negative view on government bonds. Government bonds are not attractive in the current macroeconomic context, and do not bring reliable diversification in portfolios. We keep a constructive stance on Credit and Emerging Market (EM) debt. EM debt remains supported by global growth dynamic, a weaker US dollar, contained public debt and corporate leverage, as well as strong flows, even if spreads are tight. While Credit markets continue to exhibit tight spread levels despite the recent slight widening, those levels appear coherent with the positive economic growth backdrop and provide interesting carry and absolute yields for a fixed income portfolio.

We are neutral the dollar against all currencies.

On the EUR/USD, we still expect a weaker USD trajectory over the long-term. This is due to a likely looser monetary policy versus the EUR and higher accumulated inflation. Meanwhile, political intentions to weaken the USD remain—attempts to dismantle the institutional set up behind the USD—and the twin deficit persists.

Short term factors balance each other out, but economic policies seem key:

  • An inflation differential outlook with US prices rising more than Eurozone -inflation speaks against USD
  • A higher interest rate differential and a stronger economic activity in the US vs the EMU speaks for the USD
  • The Fed is unlikely to adopt a more dovish stance than markets currently expect, while the ECB is expected to keep policy unchanged

We thus expect the USD to move sideways versus the EUR in the short term and stay negative USD long term.

These short and long-term views are also valid for the USD/CHF.


ASSET ALLOCATION GRID 

TACTICAL ASSET ALLOCATION (TAA) – 19.2.2026


INVESTMENT CONCLUSIONS

  • On 20 February, the US Supreme Court invalidated Trump’s tariffs imposed under the International Emergency Economic Powers Act (IEEPA) on the United States’ global trading partners. In response, the US administration moved swiftly, signalling its intention to invoke Section 122 to introduce 15% tariffs across all trading partners, while using the subsequent 150-day window to conduct additional trade-related investigations.
  • From a market standpoint, the Supreme Court’s ruling has effectively removed a key source of uncertainty. Both the decision itself and the administration’s response were largely anticipated, helping to ease concerns around unexpected policy disruption.
  • We continue to see a relatively favourable economic and earnings backdrop, and in this environment, we believe staying diversified and staying invested is the prudent approach, regardless of tariff headlines. We stay overweight equities with a preference for Emerging Markets. In the US, we see a compelling valuation in Mid-caps and Value stocks. Gold, commodities, and hedge funds remain portfolio diversifiers. We stay underweight fixed income and neutral on the dollar.
  • As always, we stick to our SAA (Strategic Asset Allocation) and will use our TAA (Tactical Asset Allocation) opportunistically.

Disclaimer

This marketing document has been issued by Bank Syz Ltd. It is not intended for distribution to, publication, provision or use by individuals or legal entities that are citizens of or reside in a state, country or jurisdiction in which applicable laws and regulations prohibit its distribution, publication, provision or use. It is not directed to any person or entity to whom it would be illegal to send such marketing material. This document is intended for informational purposes only and should not be construed as an offer, solicitation or recommendation for the subscription, purchase, sale or safekeeping of any security or financial instrument or for the engagement in any other transaction, as the provision of any investment advice or service, or as a contractual document. Nothing in this document constitutes an investment, legal, tax or accounting advice or a representation that any investment or strategy is suitable or appropriate for an investor's particular and individual circumstances, nor does it constitute a personalized investment advice for any investor. This document reflects the information, opinions and comments of Bank Syz Ltd. as of the date of its publication, which are subject to change without notice. The opinions and comments of the authors in this document reflect their current views and may not coincide with those of other Syz Group entities or third parties, which may have reached different conclusions. The market valuations, terms and calculations contained herein are estimates only. The information provided comes from sources deemed reliable, but Bank Syz Ltd. does not guarantee its completeness, accuracy, reliability and actuality. Past performance gives no indication of nor guarantees current or future results. Bank Syz Ltd. accepts no liability for any loss arising from the use of this document.

Read More

Straight from the Desk

Syz the moment

Live feeds, charts, breaking stories, all day long.

Thinking out loud

Sign up for our weekly email highlighting the most popular posts.

Follow us

Thinking out loud

Investing with intelligence

Our latest research, commentary and market outlooks