
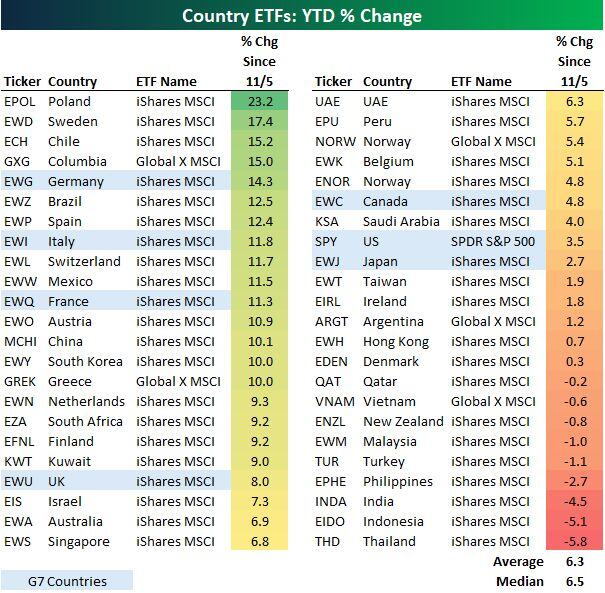
It's been awhile since the US S&P500 $SPY has been in the bottom half of country ETF performance.
Disclaimer
This marketing document has been issued by Bank Syz Ltd. It is not intended for distribution to, publication, provision or use by individuals or legal entities that are citizens of or reside in a state, country or jurisdiction in which applicable laws and regulations prohibit its distribution, publication, provision or use. It is not directed to any person or entity to whom it would be illegal to send such marketing material. This document is intended for informational purposes only and should not be construed as an offer, solicitation or recommendation for the subscription, purchase, sale or safekeeping of any security or financial instrument or for the engagement in any other transaction, as the provision of any investment advice or service, or as a contractual document. Nothing in this document constitutes an investment, legal, tax or accounting advice or a representation that any investment or strategy is suitable or appropriate for an investor's particular and individual circumstances, nor does it constitute a personalized investment advice for any investor. This document reflects the information, opinions and comments of Bank Syz Ltd. as of the date of its publication, which are subject to change without notice. The opinions and comments of the authors in this document reflect their current views and may not coincide with those of other Syz Group entities or third parties, which may have reached different conclusions. The market valuations, terms and calculations contained herein are estimates only. The information provided comes from sources deemed reliable, but Bank Syz Ltd. does not guarantee its completeness, accuracy, reliability and actuality. Past performance gives no indication of nor guarantees current or future results. Bank Syz Ltd. accepts no liability for any loss arising from the use of this document.
Related Articles
US-listed funds now hold around $200 billion in assets, equivalent to roughly $400 billion of market exposure, while trading volumes are running about 50% above last year's record pace. Market structure increasingly matters. Source: TME, JP Morgan
The ARK Innovation ETF, $ARKK, recorded ~$7 billion in inflows in June, the largest in nearly a year, with the surge coinciding precisely with the day of the SpaceX IPO. Over the first 3 trading sessions following its IPO, retail investors purchased a net $369.8 million of SpaceX, $SPCX, according to Vanda Research. By comparison, retail investors purchased just $88.2 million of Nvidia, $NVDA, over the same time. SpaceX's 3-day retail purchases roughly matched the COMBINED total of Nvidia, Alphabet, Amazon, Microsoft, Meta, the S&P 500 ETF, $SPY, and the Nasdaq 100 ETF, $QQQ. The retail mania is unlike anything seen before. Source: Global Markets Investor, Bloomberg