
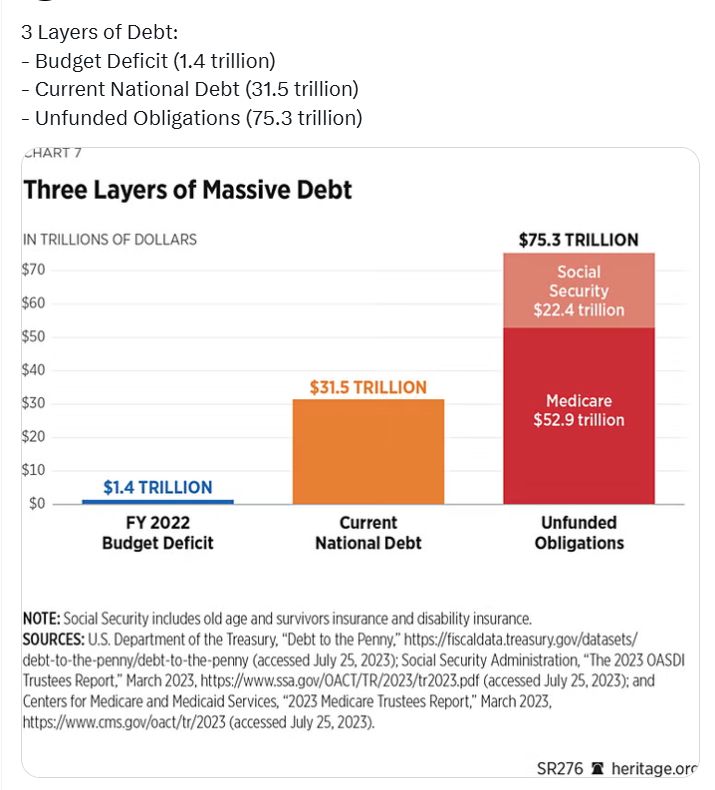
America's massive leverage summarized in one chart
Disclaimer
This marketing document has been issued by Bank Syz Ltd. It is not intended for distribution to, publication, provision or use by individuals or legal entities that are citizens of or reside in a state, country or jurisdiction in which applicable laws and regulations prohibit its distribution, publication, provision or use. It is not directed to any person or entity to whom it would be illegal to send such marketing material. This document is intended for informational purposes only and should not be construed as an offer, solicitation or recommendation for the subscription, purchase, sale or safekeeping of any security or financial instrument or for the engagement in any other transaction, as the provision of any investment advice or service, or as a contractual document. Nothing in this document constitutes an investment, legal, tax or accounting advice or a representation that any investment or strategy is suitable or appropriate for an investor's particular and individual circumstances, nor does it constitute a personalized investment advice for any investor. This document reflects the information, opinions and comments of Bank Syz Ltd. as of the date of its publication, which are subject to change without notice. The opinions and comments of the authors in this document reflect their current views and may not coincide with those of other Syz Group entities or third parties, which may have reached different conclusions. The market valuations, terms and calculations contained herein are estimates only. The information provided comes from sources deemed reliable, but Bank Syz Ltd. does not guarantee its completeness, accuracy, reliability and actuality. Past performance gives no indication of nor guarantees current or future results. Bank Syz Ltd. accepts no liability for any loss arising from the use of this document.
Related Articles
Stocks now make up a record-high share of U.S. household assets, Axios reports. American household wealth is now more tied to equities than ever before, making consumers more exposed to market swings. Source: Coin Bureau
Source: BofA, Barchart
For the first time in history, U.S. oil exports have surpassed China's crude oil imports. At first glance, it looks like just two lines crossing on a chart. In reality, it could mark a profound structural change. For two years, China's crude imports hovered around 12–14 million barrels per day. Then they suddenly plunged to roughly 8.5 million. At the same time, U.S. oil exports, long stuck around 9–10 million barrels per day, surged above 12 million. Why? China didn't stop buying oil because demand disappeared. It stopped because supply became constrained. • Nearly 38% of China's crude imports depended on the Strait of Hormuz. • Gulf producers faced major disruptions. • Russia was already exporting at full capacity. • U.S. light sweet crude isn't an ideal substitute for many Chinese refineries. With few alternatives, China began drawing down strategic inventories instead of importing. That collapse in imports isn't necessarily a sign of weaker demand. It may be evidence of a country relying on its emergency reserves to navigate one of the biggest supply shocks in years. Meanwhile, U.S. exporters stepped in to replace part of the missing Gulf supply. Sometimes, the most important geopolitical shifts don't make the front page. They simply appear when two lines cross on a chart. Source. Jack Prandelli on X, IEA