

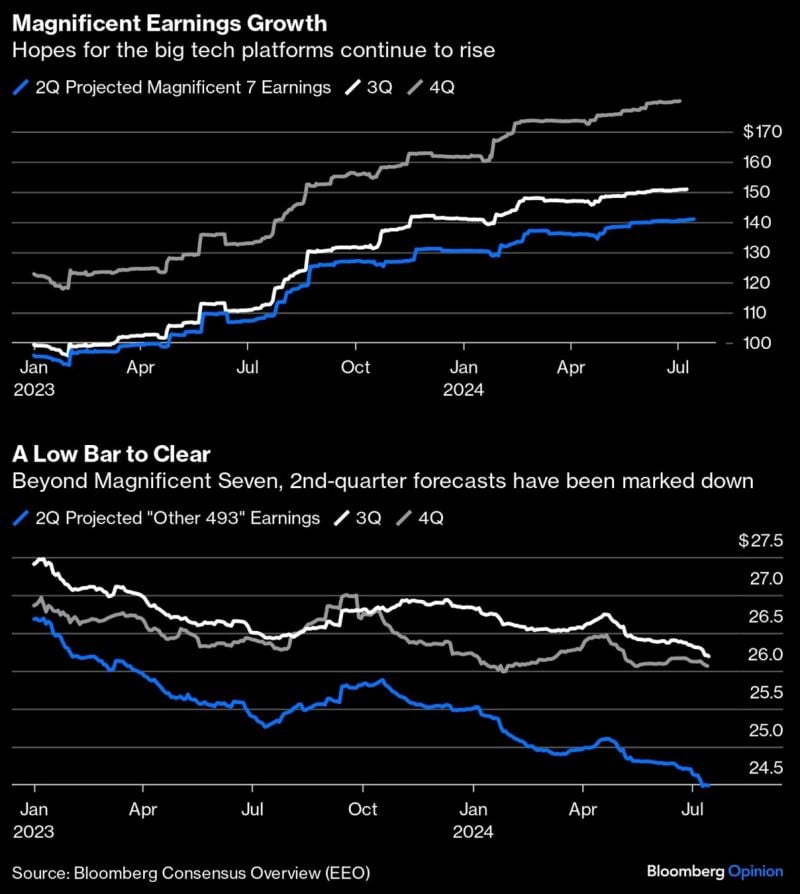
There are 2 ways to look at this chart:
Disclaimer
This marketing document has been issued by Bank Syz Ltd. It is not intended for distribution to, publication, provision or use by individuals or legal entities that are citizens of or reside in a state, country or jurisdiction in which applicable laws and regulations prohibit its distribution, publication, provision or use. It is not directed to any person or entity to whom it would be illegal to send such marketing material. This document is intended for informational purposes only and should not be construed as an offer, solicitation or recommendation for the subscription, purchase, sale or safekeeping of any security or financial instrument or for the engagement in any other transaction, as the provision of any investment advice or service, or as a contractual document. Nothing in this document constitutes an investment, legal, tax or accounting advice or a representation that any investment or strategy is suitable or appropriate for an investor's particular and individual circumstances, nor does it constitute a personalized investment advice for any investor. This document reflects the information, opinions and comments of Bank Syz Ltd. as of the date of its publication, which are subject to change without notice. The opinions and comments of the authors in this document reflect their current views and may not coincide with those of other Syz Group entities or third parties, which may have reached different conclusions. The market valuations, terms and calculations contained herein are estimates only. The information provided comes from sources deemed reliable, but Bank Syz Ltd. does not guarantee its completeness, accuracy, reliability and actuality. Past performance gives no indication of nor guarantees current or future results. Bank Syz Ltd. accepts no liability for any loss arising from the use of this document.
Related Articles
Q1 FY2027 delivered a major datapoint for the AI bull case: Oracle’s trailing 12-month operating cash flow reached $46.9 billion. • +118% year-on-year • +47% quarter-on-quarter • Nearly $15 billion added in one quarter Yes, Oracle’s capital expenditure remains enormous. But that is precisely the strategy: build the computing and data-center capacity needed to serve one of the industry’s largest contracted AI backlogs. The key question was whether this massive infrastructure investment would eventually translate into revenue and cash generation. As capacity comes online and remaining performance obligations convert into sales, the answer is becoming clearer. AI infrastructure is moving from capital expenditure… …to cash flow. $ORCL Source: Steven Fiorillo
Q1 Adj. EPS: $1.92 vs $1.74 est Q1 Sales: $19.300B vs $19.144B est Raised FY2027 Adj EPS Guidance Raised FY2027 Sales Guidance Stock was up+7.85% during after-hours trading (The stock still needs to rally 112% to see its all-time high again...) Here are the details: ORACLE $ORCL Q1’27 EARNINGS HIGHLIGHTS 🔹 Revenue: $19.3B (Est. $19.14B) ; +30% YoY 🔹 Adj. EPS: $1.92 (Est. $1.74) ; +30% YoY 🔹 RPO: $664B; +$209B YoY FY Guide: 🔹 Revenue: At least $90B (Est. $89.79B) 🔹 Adj. EPS: $8.10 (Est. $8.07) Q2 Guide: 🔹 Adj. EPS: $1.85-$1.93 USD (Est. $1.89) 🔹 Revenue Growth: 30% to 34% USD/CC 🔹 Cloud Revenue Growth: 65% to 71% USD; 64% to 70% CC Segment Net Revenue: 🔹 Cloud: $11.6B; +62% YoY 🔹 Cloud Infrastructure: $7.4B; +121% YoY 🔹 Cloud Applications: $4.2B; +10% YoY 🔹 Software: $5.6B; -3% YoY 🔹 Hardware: $774M; +15% YoY 🔹 Services: $1.4B; +5% YoY Other Q1 Metrics: 🔹 Non-GAAP Operating Income: $8.2B; +31% YoY 🔹 Non-GAAP Operating Margin: 42% 🔹 Operating Cash Flow: $23.1B; +184% YoY 🔹 Free Cash Flow: -$5.4B 🔹 CapEx: $28.5B Key Updates: 🔹 AI Cloud Contracts: More than $30B booked in Q1, increasing RPO to $664B 🔹 ATM Equity Program: $20B of common stock sold before commissions Source: Trend Spider, Wall St Engine
But for now, this bubble looks different than the dot-com one Source: Pictet Asset Management, Refinitiv