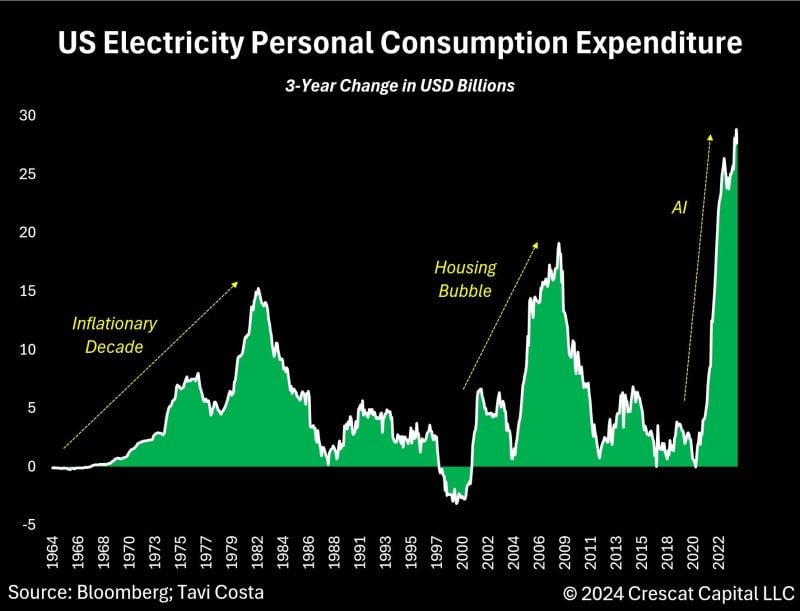
Electricity consumption has skyrocketed, and this is just the beginning.
As highlighted by Otavio (Tavi) Costa, the surge in electric cars, electric heating, and new AI advancements is dramatically increasing our electricity needs. Among the questions raised? 1) Is the global economy prepared for these changes? 2) Could AI be inflationary in the short run and deflationary in the long run? The extensive infrastructure necessary to harness AI requires hardware expansion, while commodities (particularly metals) remain historically constrained. Source: Crescat Capital, Bloomberg
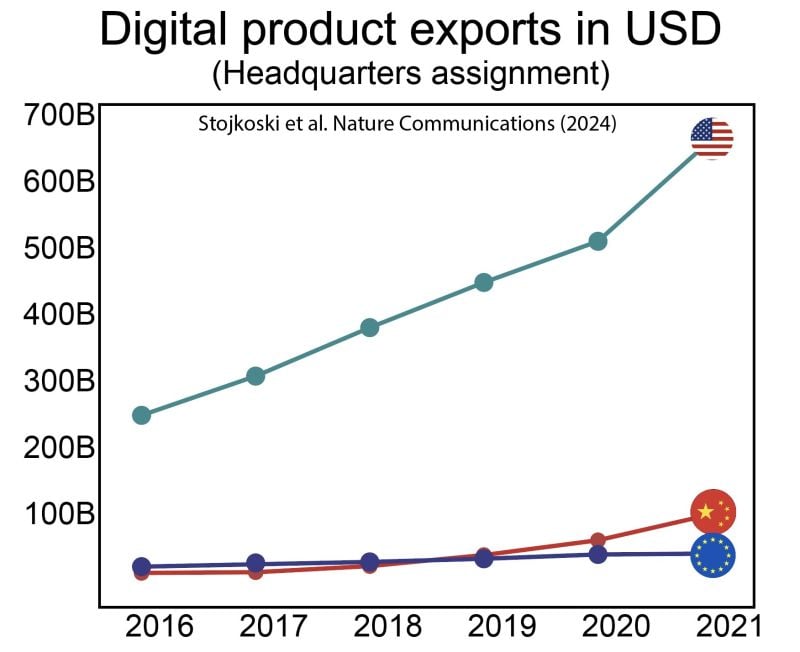
Wondering why the US stockmarket is eating the world?
Here's a visualisation of the digital trade divide... Markets & Mayhem
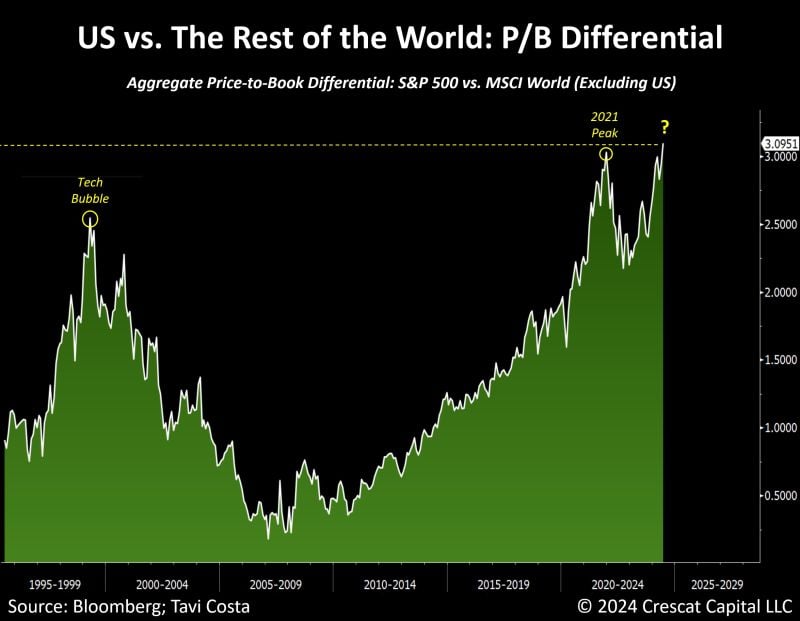
US equity markets have never been more expensive than the rest of the world on a price to book basis.
Source: Tavi Costa, Bloomberg
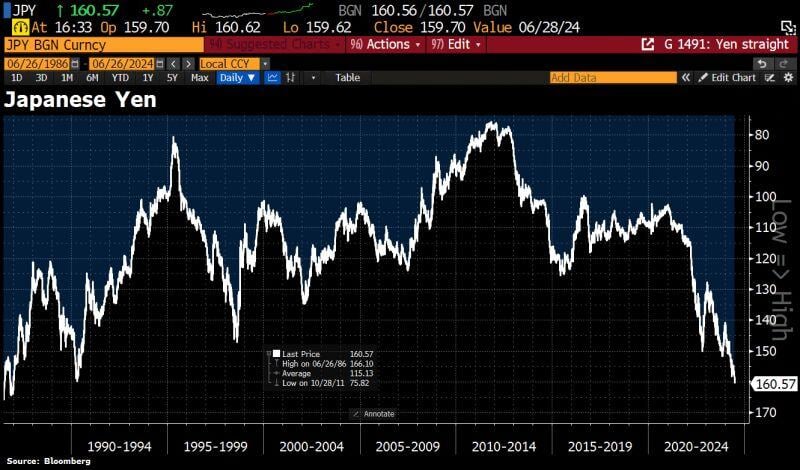
Japan's Yen weakens beyond 160 per Dollar, the weakest level since 1986.
Source: Bloomberg, HolgerZ
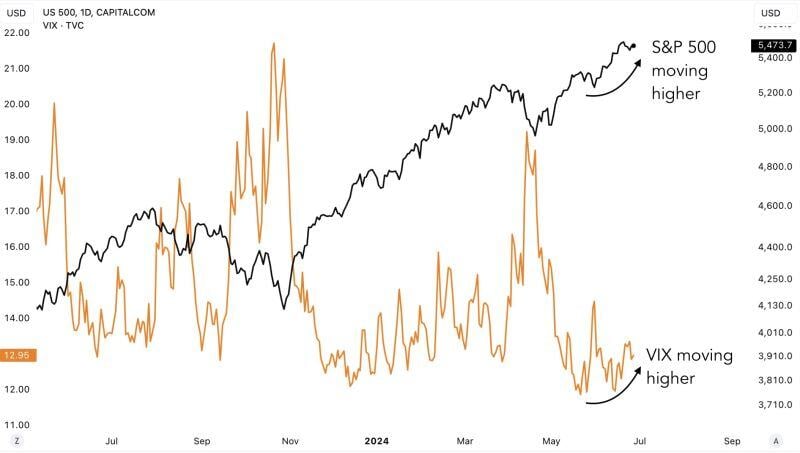
Major divergence spotted:
The VIX has been trending higher since mid-May. But even the SP500 has been moving higher. This is an anomaly. Source: Game of Trades
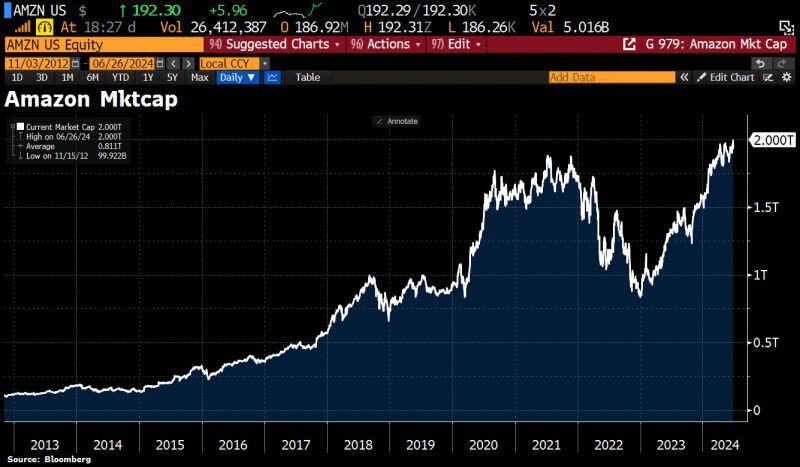
Amazon enters elite $2tn club as AI optimism fuels rally.
Amazon up ~27% this year, driven by improving growth trends as AI re-accelerates its cloud-computing business. The milestone puts Amazon into an exclusive club of comps worth $2tn or more: Alphabet crossed the level in April, while Nvidia, Microsoft, and Apple are all worth north of $3tn. (via BBG)
Jensen Huang said that the next wave of AI is set to automate $50 TRILLION heavy industries
He also said, "The Blackwell architecture platform will likely be the most successful product in our history and for the entire history of computers." Source: Stocktwits

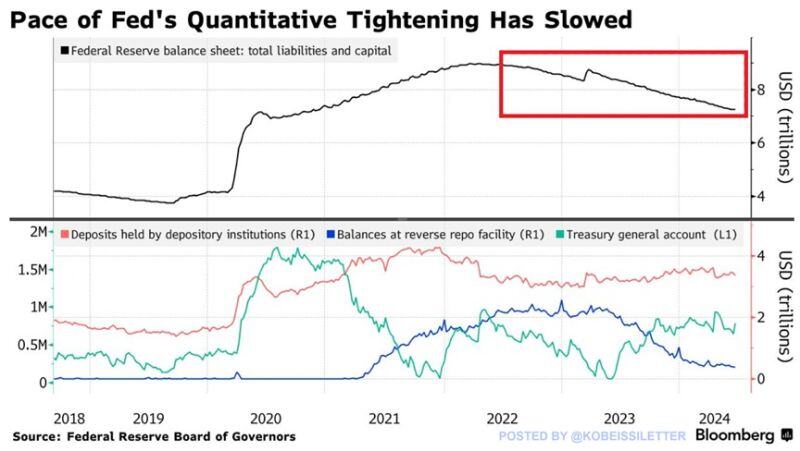
The Fed has been shrinking its balance sheet at the fastest pace ever:
Since April 2022, the Federal Reserve has reduced its balance sheet by $1.71 trillion to $7.25 trillion, a 19% decline. By comparison, from 2017 to 2019 the Fed’s balance sheet runoff amounted to 16%. However, the Fed's balance sheet still stands $3.1 TRILLION above pre-pandemic levels. Meanwhile, the Fed slowed the pace of runoff from $95 billion to $60 billion a month at the beginning of June. Will the Fed's balance sheet ever reach pre-pandemic levels?