waouuu...
Are US homes sellers so desperate?

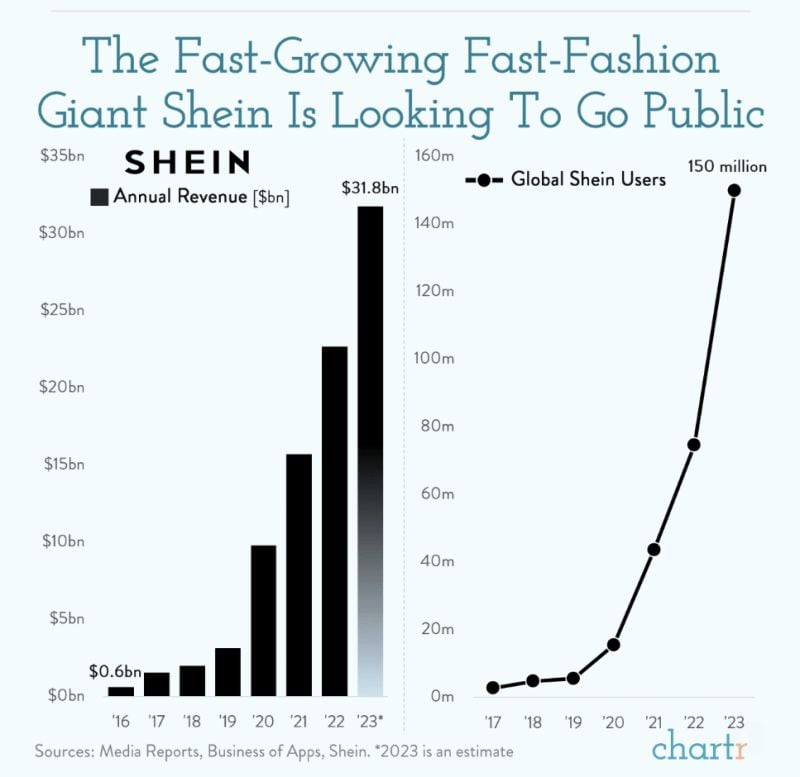
Fast-fashion giant Shein has filed confidential paperwork for a potential public listing in early 2024
seeking a valuation of up to $90 billion (per Bloomberg), which would make the 15-year-old company more valuable than Lululemon and H&M combined. Established in China in 2008 as ZZKKO, Shein puts the fast in fast fashion: dropping as many as 10,000 new items on its website every day, producing items in small batches (50-100), and only ramping supply reactively for any products getting a lot of demand. Its wallet-friendly offerings — like earrings for less than 50¢ — have won over young consumers across the world, with its US customer base helping to catapult the company’s sales up 45% year-over-year, to $23 billion in 2022. Source: Chartr
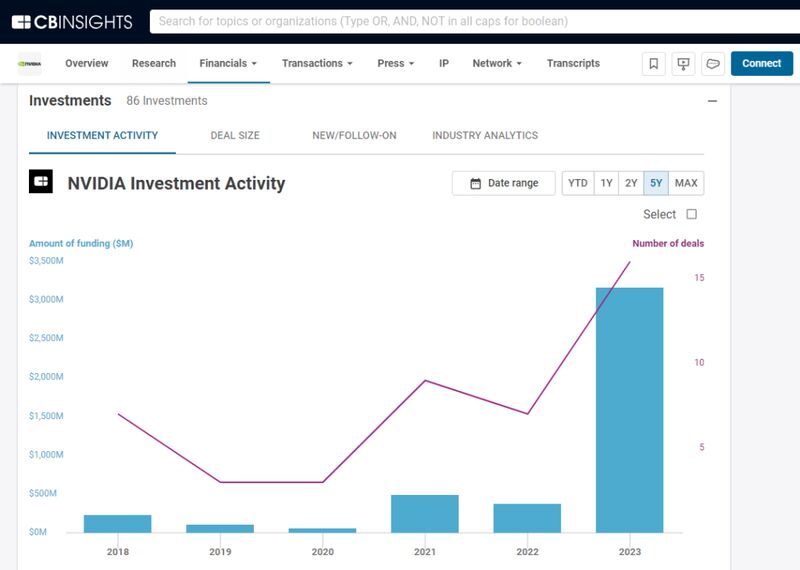
Nvdia in a virtuous cycle?
As highlighted, by Kakashii, Nvidia is somewhat fuelling their own growth by investing in AI startups which will purchase their AI chips! Indeed, Nvidia is one of generative AI’s most active investors. Let's review some of the deals the chipmaker is backing. Behind the scenes, Nvidia has been investing heavily in generative AI companies. The chipmaker’s overall deal activity has climbed dramatically in 2023 (see chart below)
Among the famous Charlie Munger quotes
Source: Ticker History
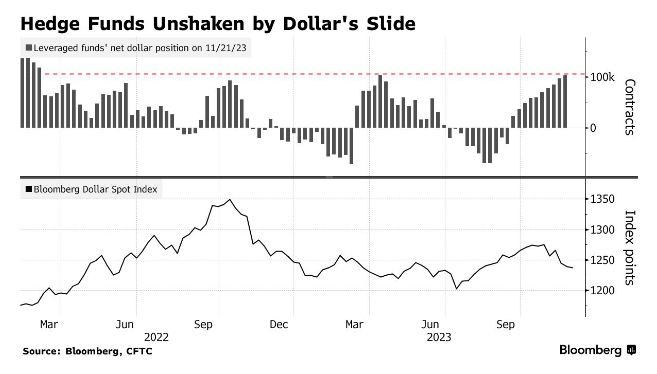
Hedge Funds now have the largest long position in the US dollar since February 2022
Source: Barchart, Bloomberg
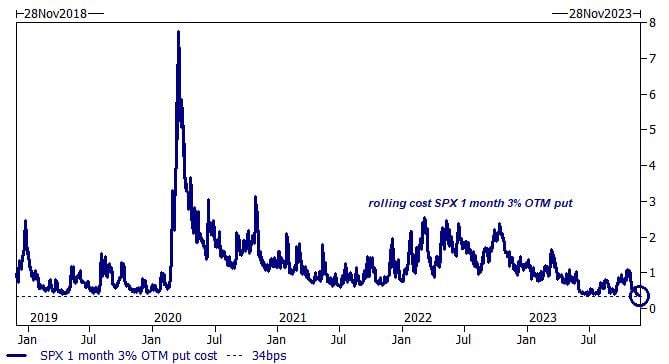
Goldman: Hedging against a market crash is the cheapest in more than five years...
The chart below shows the cost of a rolling SPX 1 month 3% OTM put: the current cost is 34 basis points, the lowest level in 5 years. Source: Goldman Sachs, TME
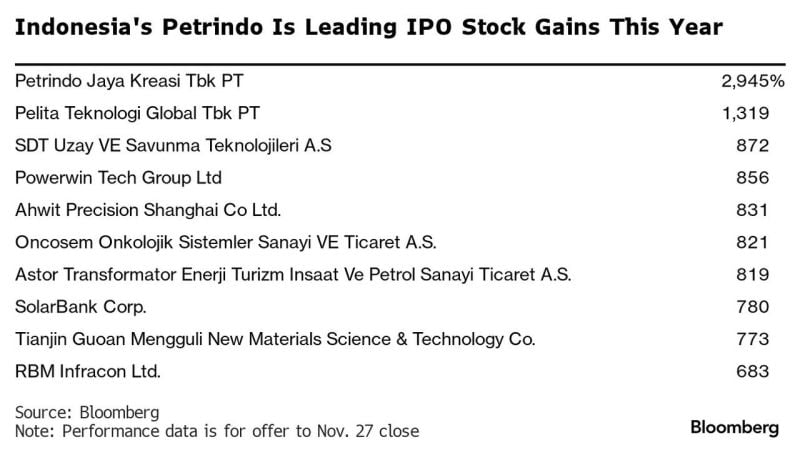
Here's the list of the best performing IPO in the world so far in 2023 YTD
The world’s best-performing IPO stock this year is a little known Indonesian coal mining company that’s backed by one of Southeast Asia’s richest men. PT Petrindo Jaya Kreasi has soared more than 2,900% since it listed in March following a $25 million offering. Yet it still has no analyst coverage, is richly valued and has relatively low trading volumes. Counting Indonesian billionaire Prajogo Pangestu as its main shareholder, the company’s market value has grown by more than 25 times to $5.4 billion in just nine months. Indonesia has been one of the most vibrant markets for initial public offerings globally this year, partially helped by a boom in demand for renewable energy stocks. Petrindo, in particular, is among a cohort of Indonesian stocks that have posted unexplained gains and wild swings this year, reaping fortunes for their backers and leading to regulatory scrutiny. Source: Bloomberg, www.zerohedge.com
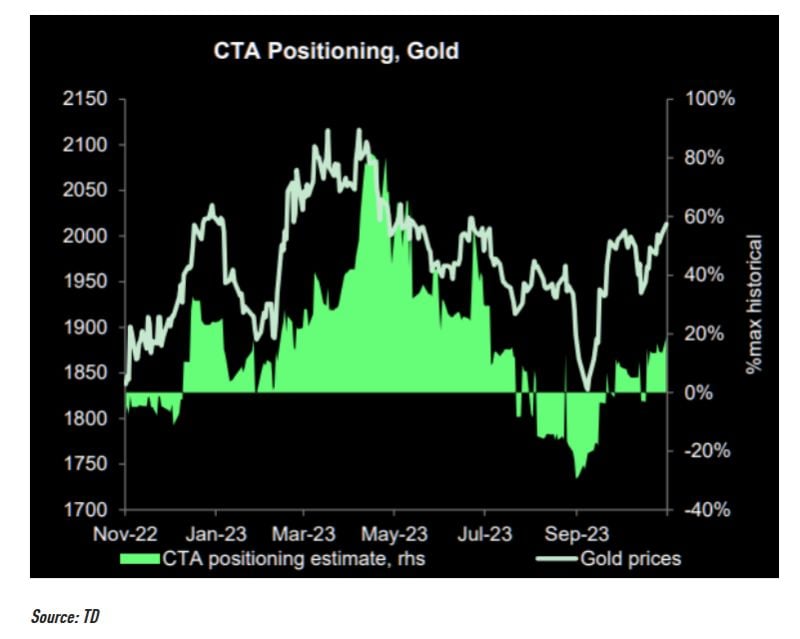
They just started buying gold...
CTAs have reversed the gold short into a long, but they could be buying much more on the back of this break out. They are more than happy to play this momentum move... Source: Bloomberg, TME