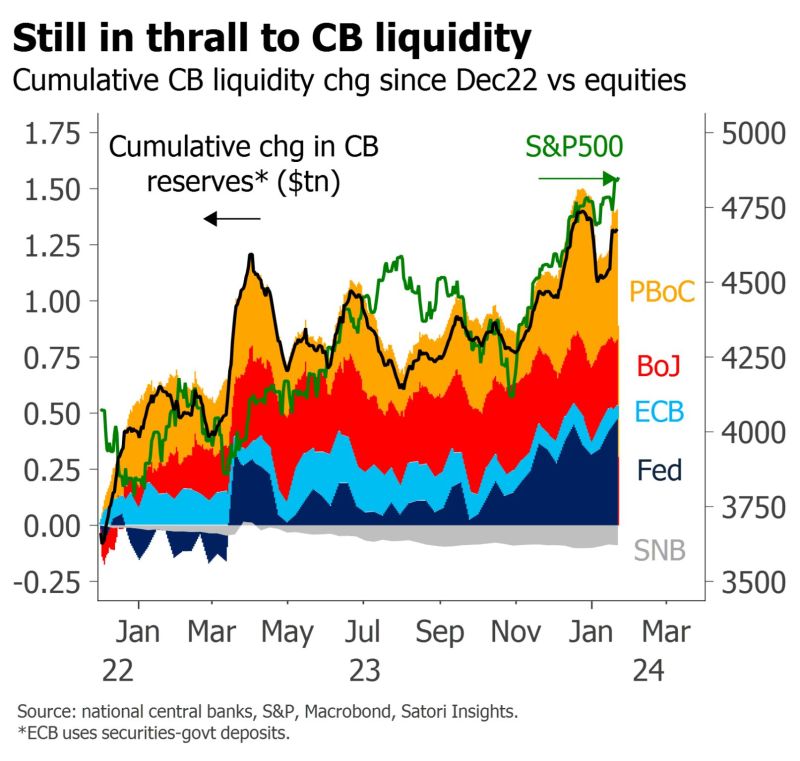
The key role played by central banks liquidity, as highlighted by Matt King
Many seem surprised by the new record highs in the S&P, given an ambiguous outlook and a backdrop of supposedly tight rates. They are a lot less surprising when you consider that central banks' balance sheet policy has been remarkably easy. Over the past 14 months, the Fed alone has added nearly $500bn, and global central banks over $1.25tn, in liquidity. Source: BofA
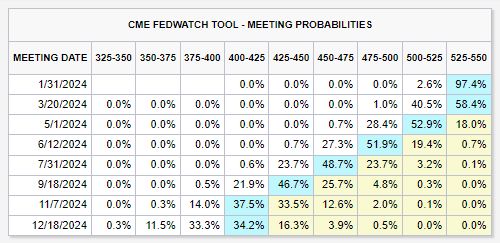
It's official: markets are no longer expecting a FED rate cut in March 2024.
There's still a ~42% chance of rate cuts beginning in March, but this is a major shift in expectations. Just two weeks ago, markets saw a 90% chance of rate cuts beginning in March. Odds of rate cuts beginning at next week's Fed meeting are now down to ~2%. We are still seeing ~150 bps of interest rate cuts priced-in to futures. But, Fed pivot hopes are slowly pulling back. Source: The Kobeissi Letter
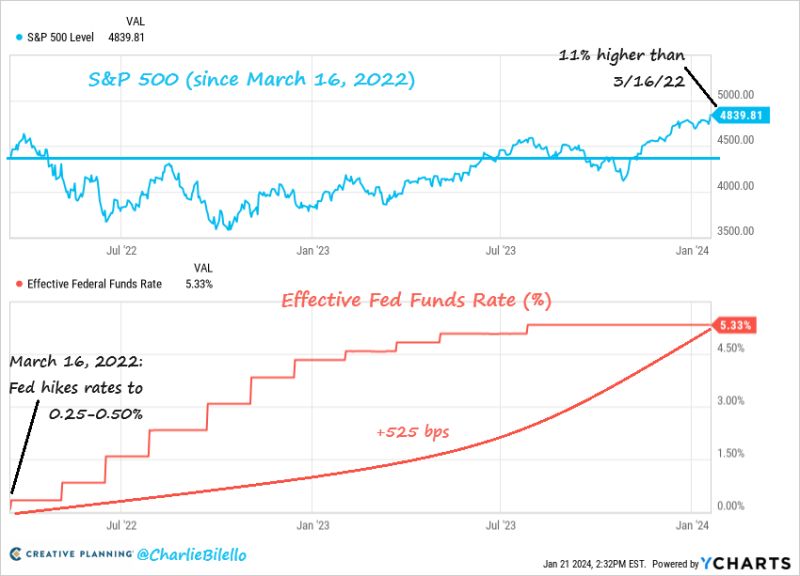
The S&P 500 is now 11% higher than where it was when the Fed started hiking rates in March 2022. $SPX
Source: Charlie Bilello
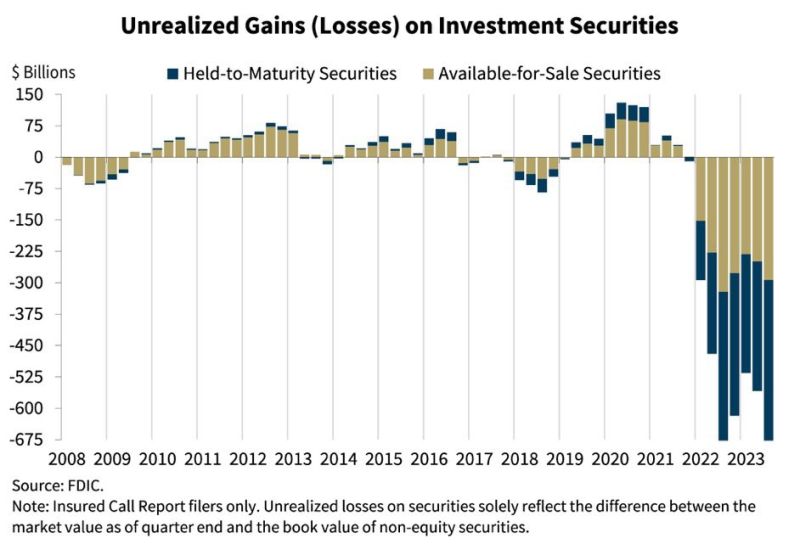
U.S. Banks are facing unrealized losses of roughly $685 billion. They are desperately hoping the Federal Reserve will cut rates sooner rather than later.
Source: Barchart, FDIC
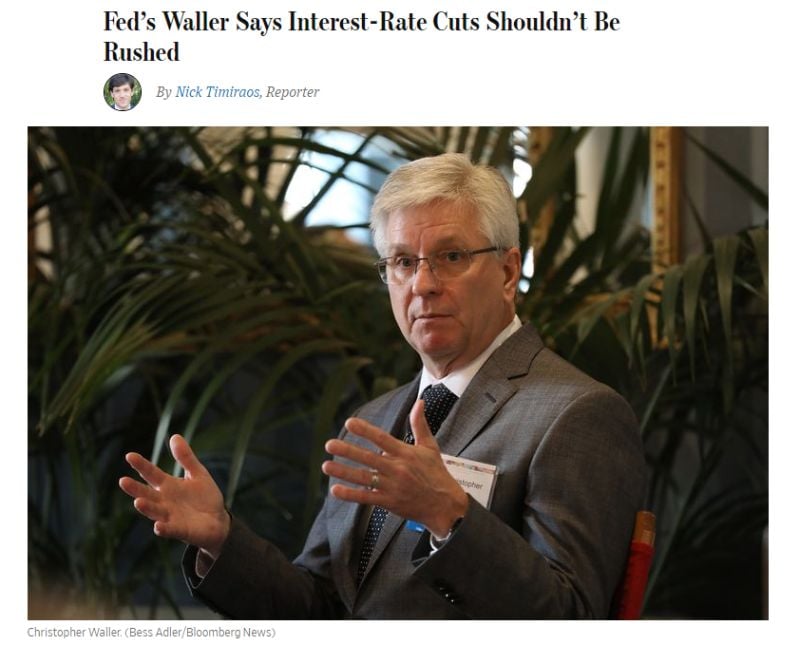
On the timing of the first cut, Waller said he believes that the FOMC will be able to lower the funds rate “this year.”
Main culprits from yesterday's pullback in Wall Street were comments by Governor Waller in a speech and discussion as they raised the risk that the first cut could come slightly later than the market's expectation of March and that the pace of cuts could be quarterly from the outset, rather than the market's more aggressive forecast of three initial consecutive cuts followed by a switch to a quarterly pace. On the speed of cuts, Waller said the funds rate “can and should be lowered methodically and carefully” and that he sees “no reason to move as quickly or cut as rapidly as in the past,” when the FOMC was combating recessions. Waller also noted that next month's scheduled revisions to CPI inflation (the seasonal factors will be revised on February 9) could influence his thinking on rates cuts, especially if the revised data show a less clear deceleration recently. The result was most evident in the drop in the market's expectations for a rate-cut in March...
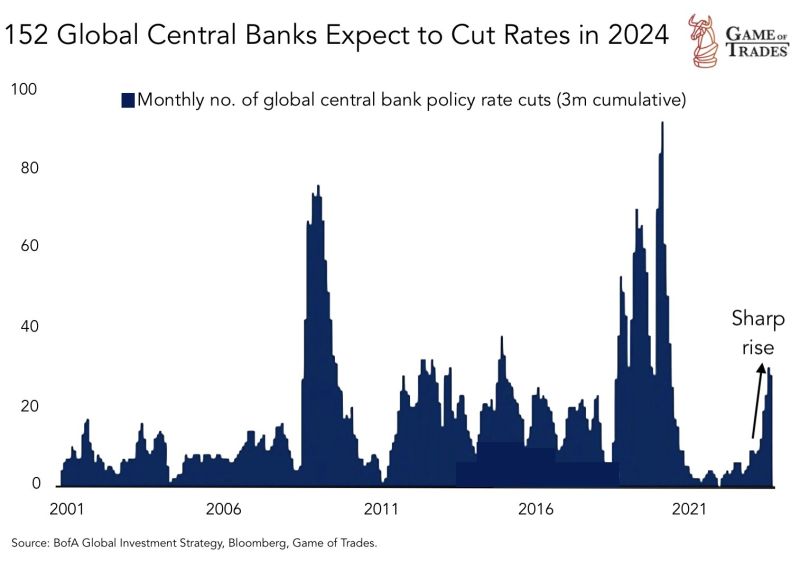
After an aggressive tightening cycle, 152 centralbanks around the world expect to cut rates in 2024, including the Fed.
Source: Games of Trades
Is this the reason why the Fed might be forced to cut rates in March?
We could have: 1. Reverse repo ends (see chart below) 2. BTFP expires 3. Fed cuts (allegedly) 4. QT ends (allegedly) I.e 3 and 4 could counter-balance 1 and 2
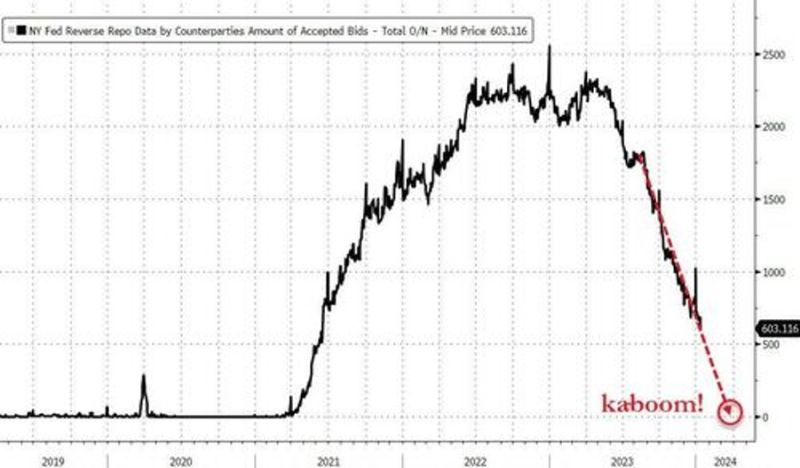
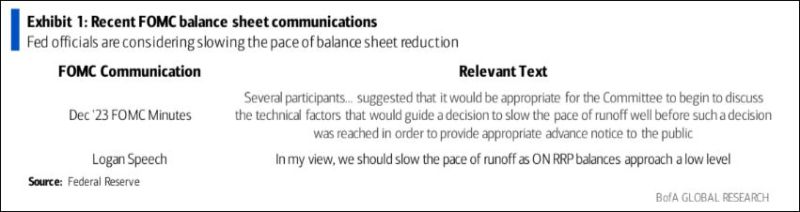
RIP QT
Source: bofA, Ronnie Stoeferle