Insane 🤯
Source: Dividend Talks on YouTube @DividendTalks
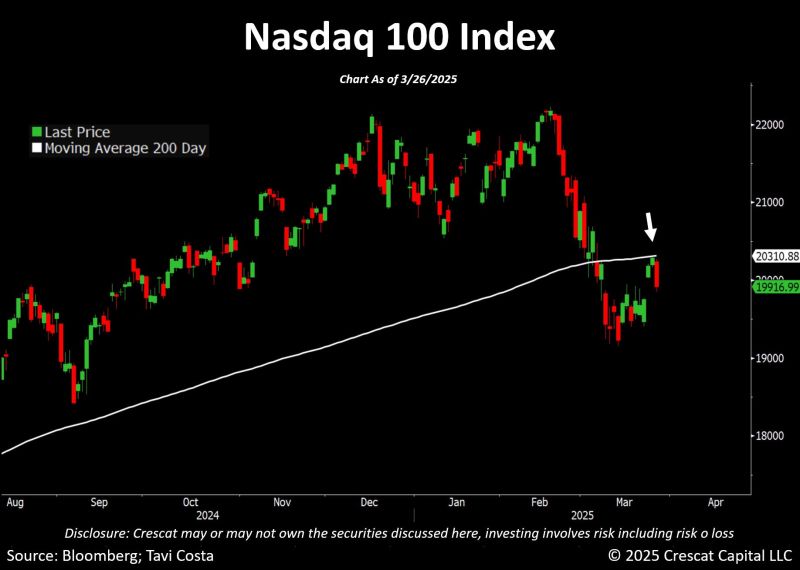
"Nothing good happens below the 200-day moving average."
— Paul Tudor Jones Source: Tavi Costa on X
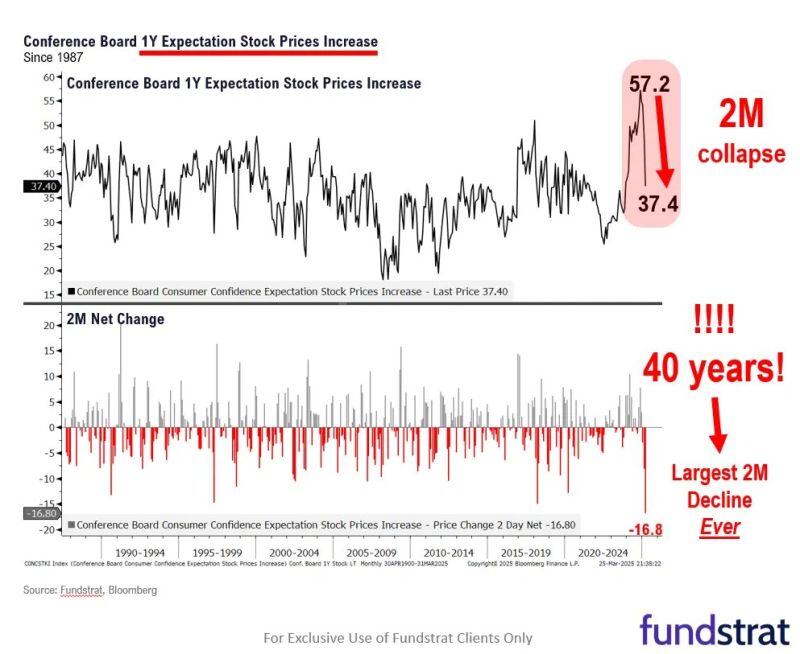
Tom Lee: Conference Board shows largest ever plunge in stock expectations, which is a contrarian buy signal
Source: Mike Zaccardi, CFA, CMT 🍖@MikeZaccardi, FundStrat
There’s another S&P 500 target cut — to a new Wall Street low
Another bank has cut its price target, and this time it’s to a new low on Wall Street. Barclays strategists say they’ve lowered their year-end S&P 500 price target to 5,900 from 6,600. That’s the lowest of any firm that’s a U.S. Treasury dealer, though Montreal-based BCA has a 4,450 year-end call. source : marketwatch

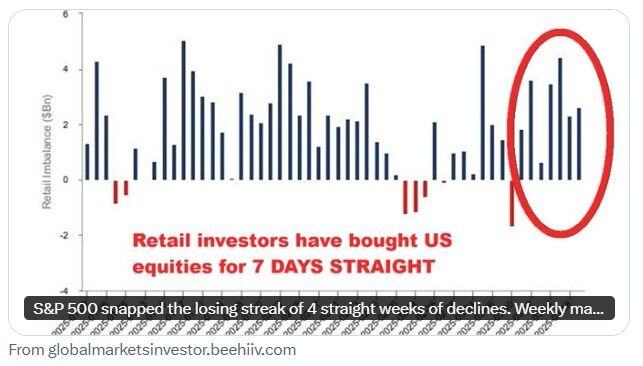
‼️'Retail investors' money is FURIOUSLY buying US equities:
Retail flows into technology stocks have more than TRIPLED in just a few weeks. Mom-and-pop investors have bought the largest US tech stocks despite the Nasdaq 100 index falling into a correction.👇 Source: Global Markets Investor
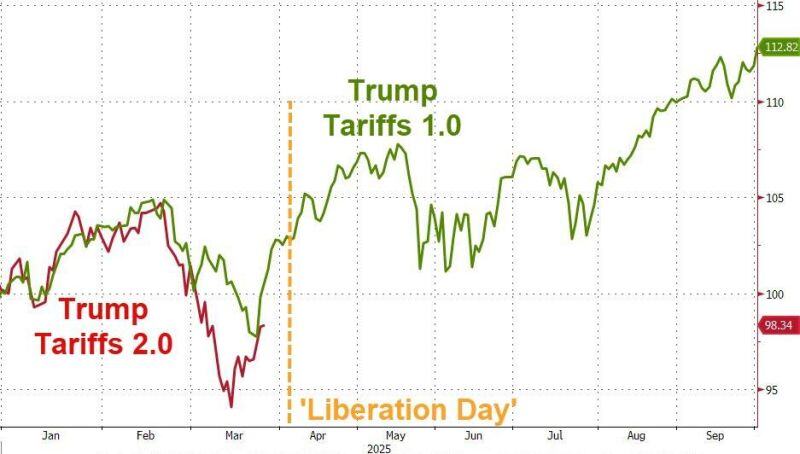
If Goldman is wrong and the market has priced in all the downside of April 2 (and then some)
it is possible that stocks will continue to rally, which means that the analogue chart between Trump 2 and Trump1 will remain valid. Source: www.zerohedge.com, Bloomberg
The S&P has closed above the 200-day moving average... WE DID IT! $SPY
The Great Market Crash of 2025 • Born: March 2025 • Died: March 2025 ??? Source: StockTwits
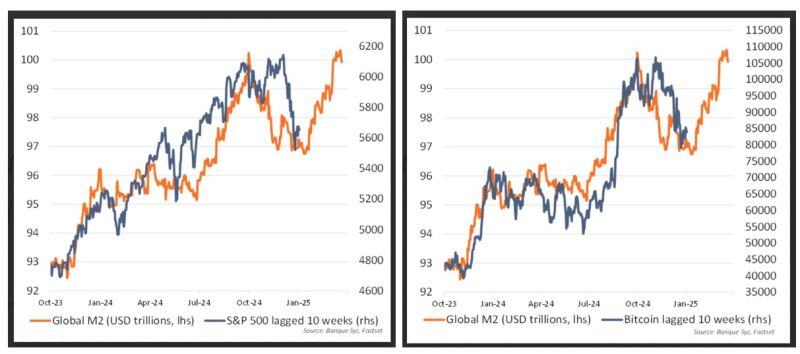
As our proprietary charts of M2 proxy (10 weeks advance) vs BTC and S&P500 suggested on Friday
The bottom could be near for risk assets as the lagged effects of a weaker dollar on global liquidity will provide a support to stocks and BTC Yesterday's advance seem to corroborate these findings. Source: Bank Syz