Unicredit under pressure
Unicredit (UCG IM) is under pressure. Keep an eye on next support level 20.69 ! If it can't hold that level, the next majort support zone to look at will be 19.60-20.00. Source : Bloomberg

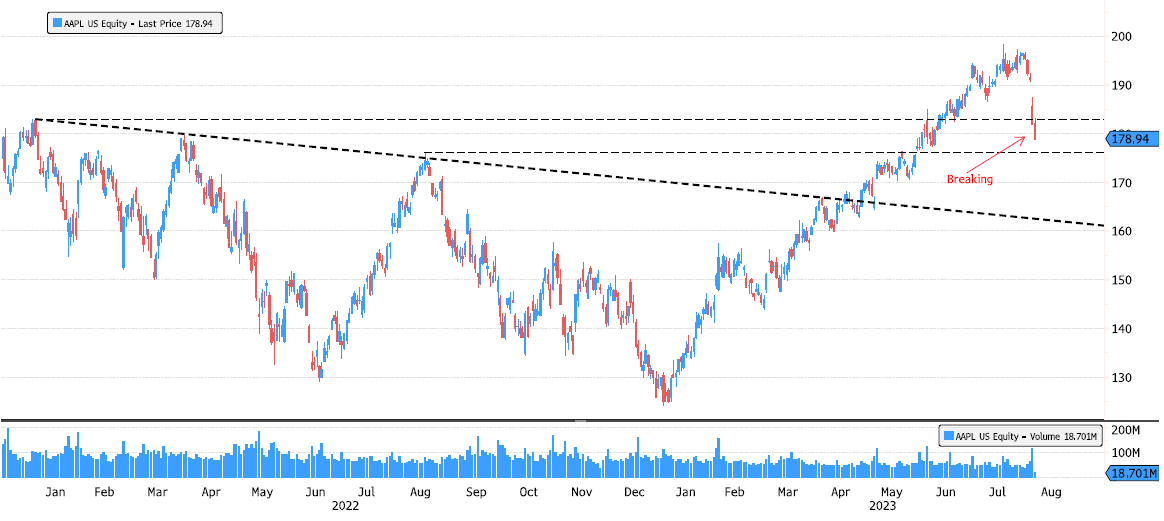
Apple breaking
Apple broke first important support at 183. Next support to keep an eye is 176.15 which was August 2022 high. If that one breaks also, will be looking at 170-160 zone which is a major level. Source Bloomberg
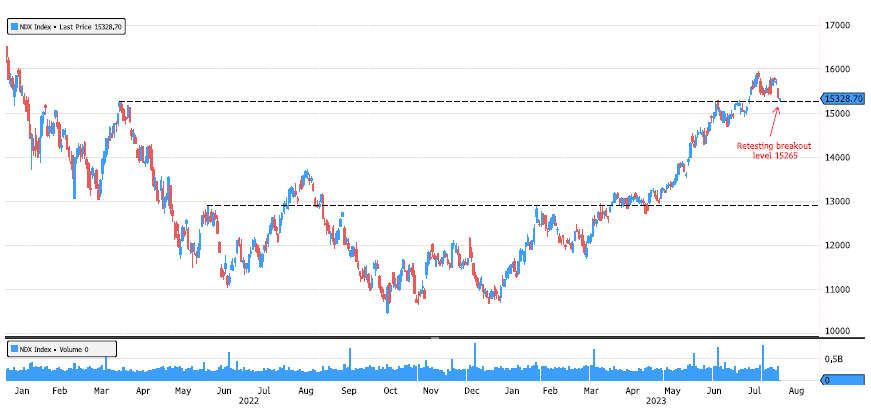
Nasdaq 100 Index retesting recent breakout level
Nasdaq 100 Index (NDX) is retesting recent breakout level at 15’265. That level is now a support represented by March 2022 high. Will it hold ? Source : Bloomberg
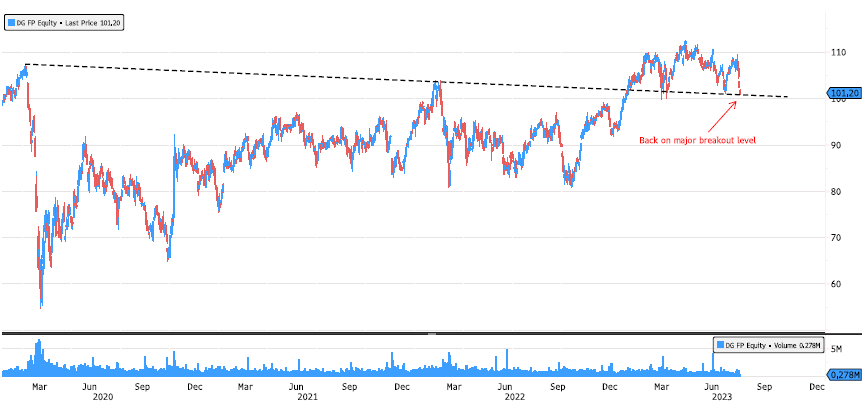
Vinci back again on major breakout level
Vinci (DG FP) is once again back on major breakout level. Will it be able to rebound ? Source Bloomberg
Salesforce is retesting recent breakout level
Salesforce (CRM US) is retesting recent breakout level and now major support level 222. Keep an eye on this level. Source Bloomberg.

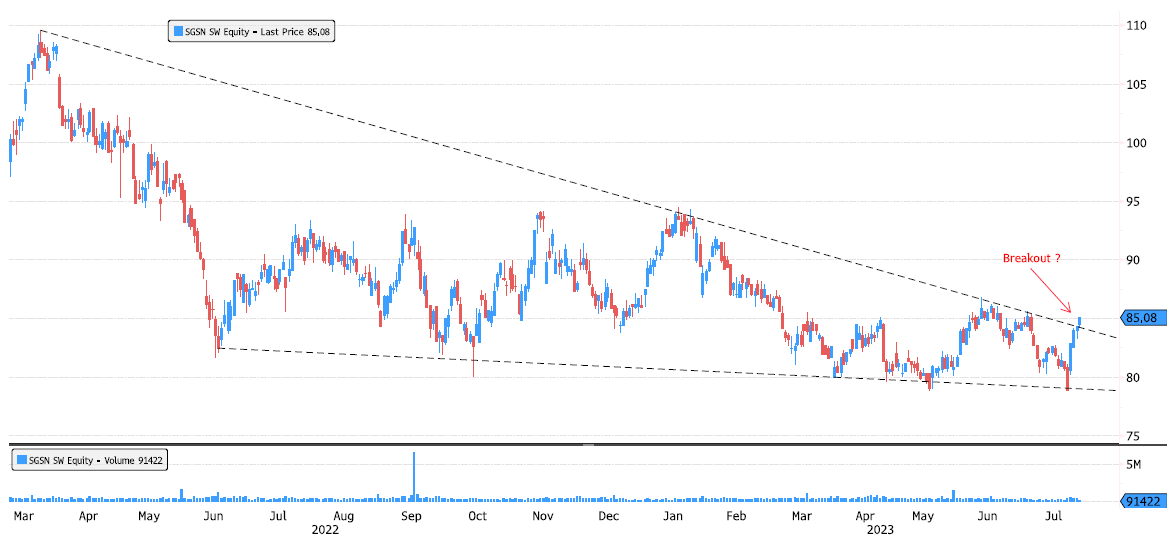
SGS 16 months triangle breakout ?
SGS (SGSN SW) is trying to break this 16 months triangle. Keep an eye at volume and also next resistance 86.74 for confirmation. Source : Bloomberg
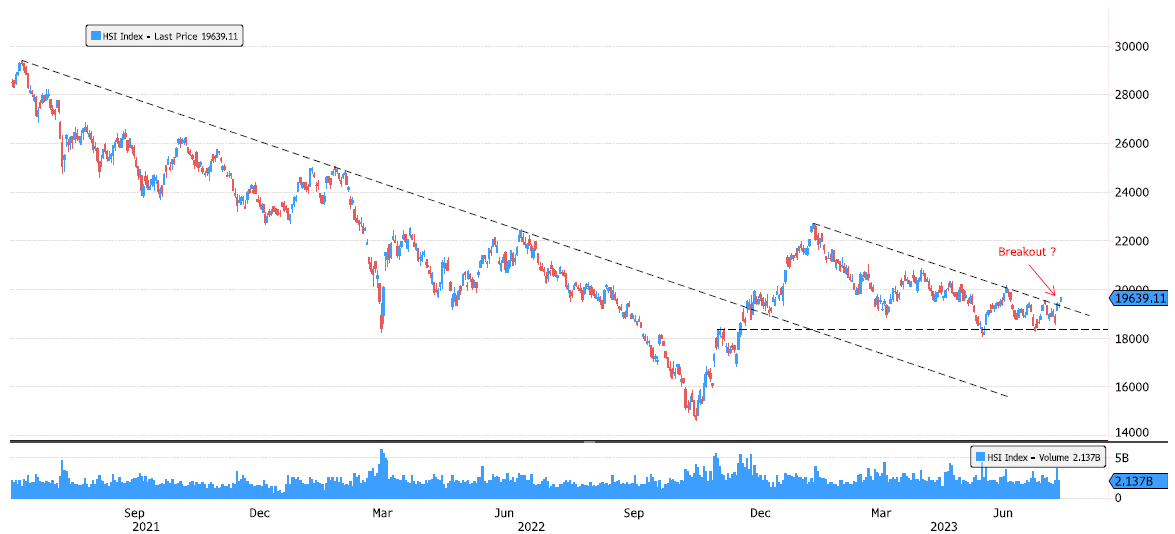
Hang Seng Index is breaking January consolidation ?
Hang Seng Index (HSI) has been consolidating for the last 6 months and is now showing signs of a breakout. Keep an eye on next resistance 20’155. Source : Bloomberg
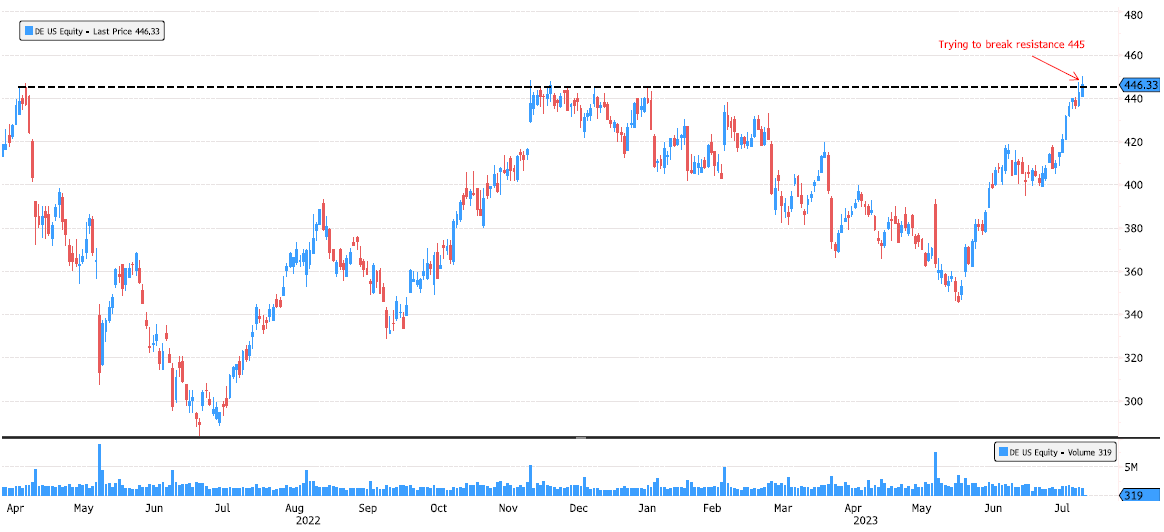
Deere trying to break resistance 445
Deere (DE US) is trying to break major resistance 445. For the moment volume is poor. Will it have enough strenght ? Source : Bloomberg