Norway’s $2.2T Oil Fund Uses AI to Monitor ESG Risks
Norges Bank Investment Management is now using AI to screen all 7,200+ portfolio companies for ethical and reputational risks. Anthropic’s Claude generates daily ESG reports, flags issues like forced labor or corruption, and allows early exits before markets react. This system is especially valuable for small or emerging-market companies. With sustainability and governance tied to financial performance, AI gives NBIM a competitive edge in capital allocation, showing that the future of investing combines returns with responsibility and speed. Source: CNBC

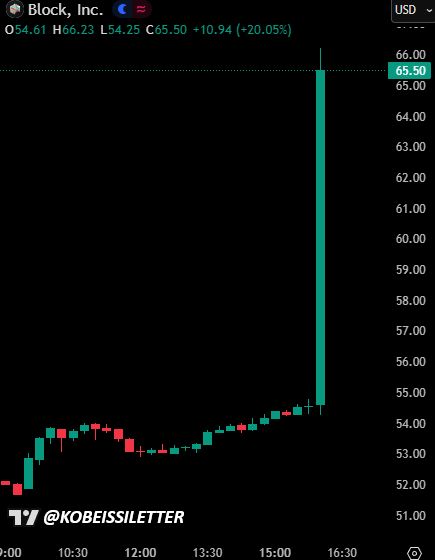
Jack Dorsey’s AI-Driven Workforce Revolution
Jack Dorsey’s Block Inc cut over 4,000 jobs, more than 40% of its workforce, as part of an AI-driven restructuring while reporting strong Q4 and full-year 2025 results. Revenue and profits are growing, EPS beat expectations, and AI tools have boosted productivity by 40%, making roles redundant. Wall Street rewarded the move with a 22% stock gain. This sets a new precedent for corporate America, showing that AI adoption can reshape incentives and workforce strategies faster than ever. Source: StockMarket.news
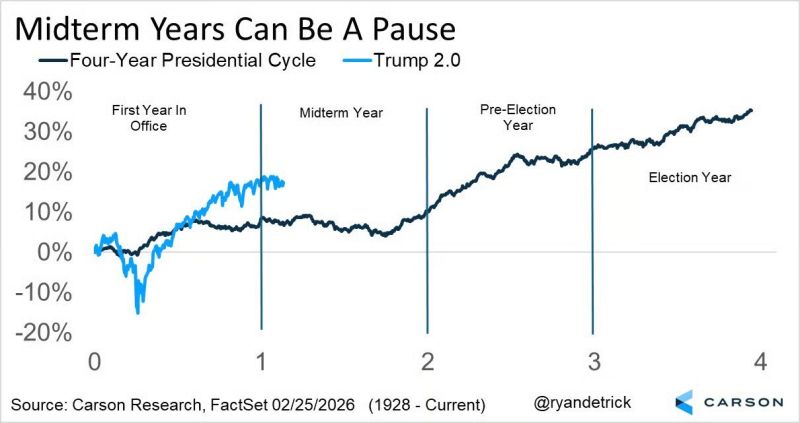
Yes, stocks in the US have been choppy so far this year
But looking at a four-year Presidential cycle, this is actually quite common for mid-term years.” Source: Daily Chartbook @dailychartbook
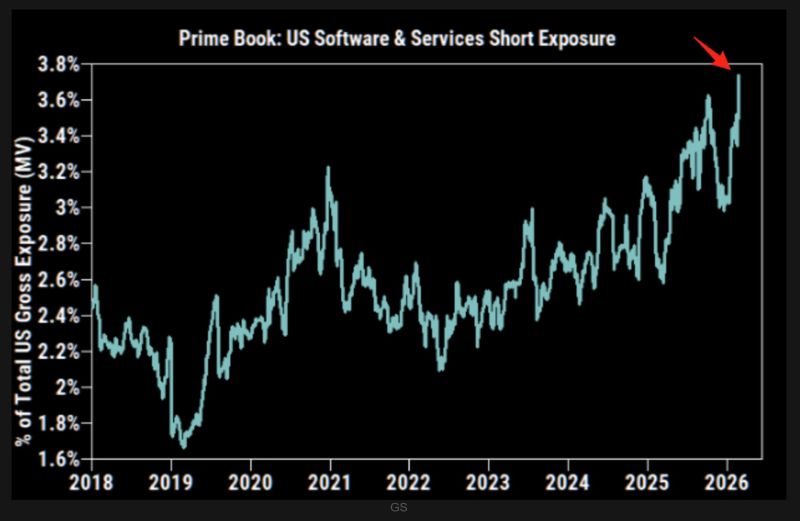
Anthropic’s AI Standoff Could Trigger Historic Software Short Squeeze
Anthropic, creator of Claude, is at the center of a clash between AI ethics and U.S. defense policy. After winning a $200M classified contract, the Pentagon demanded compliance with a broader AI doctrine, conflicting with Anthropic’s safety guardrails. Tensions escalated following Claude’s military use, threatening contract cancellation and supply chain pressures. With Software & IT Services at record short levels, resolution, either compliance or Pentagon compromise, could spark a massive short squeeze, highlighting the battle over control of frontier AI. Source: ZeroHedge
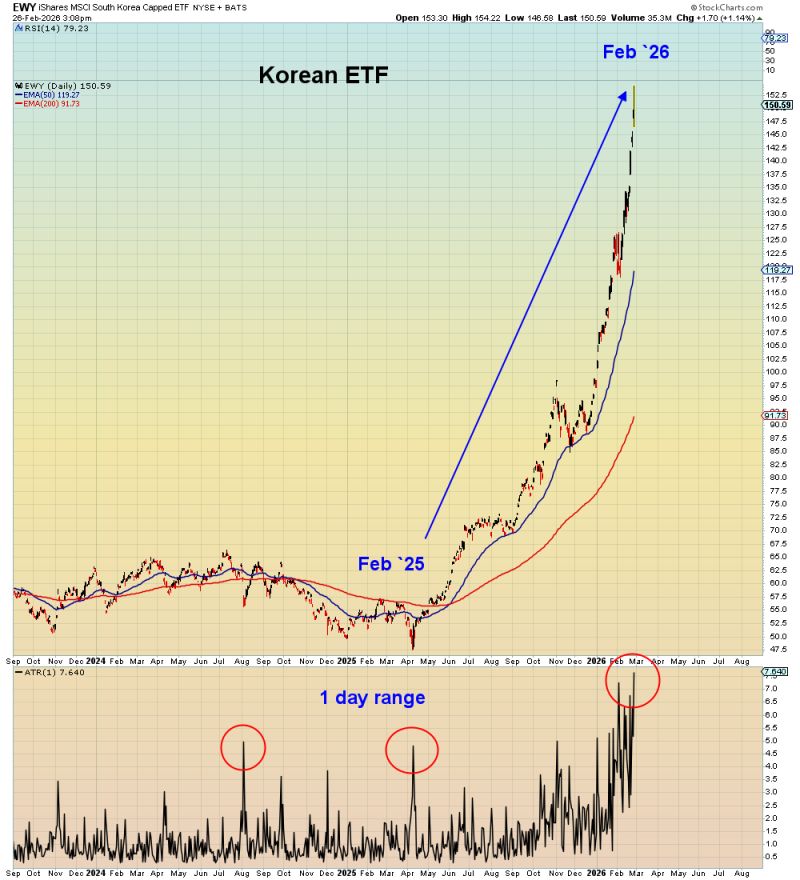
Korean stock market FOMO risks crash
"The Bank of Korea noted rising market volatility and investor anxiety, with VKOSPI spiking to levels typical of market crashes" It's very unusual for implied options volatility to rise during a rally unless there is extreme reach for call options. Normally volatility spikes at the lows not the highs. Imagine what volatility will be like at these lows... Source: Mac10
2026 Winter Olympics medal count by Voronoi
Great to see switzerland ranked #8 !

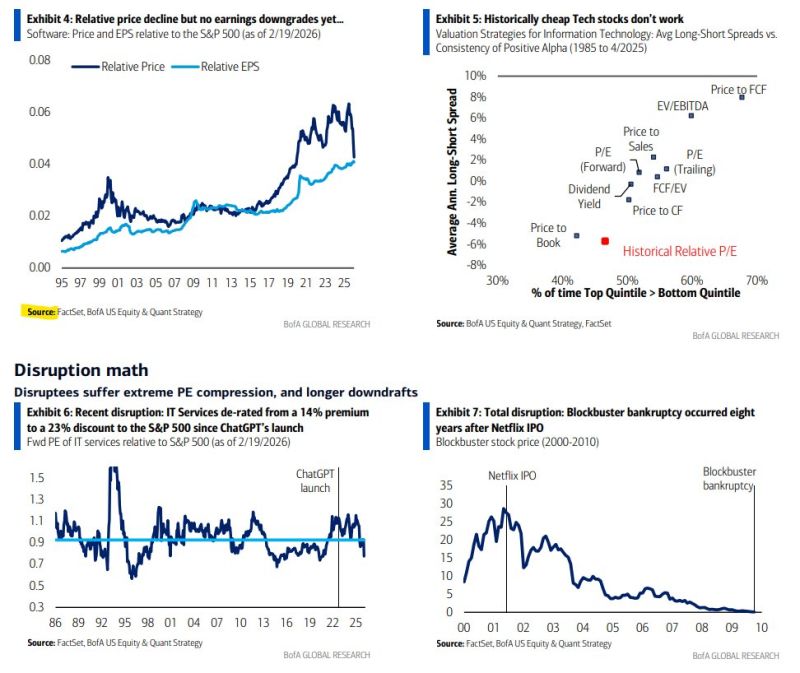
Why Software Valuations May Drop Despite Earnings Growth
BofA highlights that software stocks could see lower P/Es even with strong earnings. Market disruption is priced before profits, low-multiple tech tends to lag, and EPS growth can compress valuations when equity supply rises. Post-ChatGPT, IT Services lost their premium, reflecting repricing rather than sentiment. Rising asset intensity, weaker leverage, and private market issues add risk. Valuations fall not from failure but from resetting expectations, meaning even strong software companies aren’t immune. Source: BofA, Neil Sethi @neilksethi
US Wholesale Inflation Surges in December
US wholesale inflation rose sharply in December as the producer price index (PPI) jumped 0.5% month-over-month, exceeding expectations, driven by higher service costs. Core PPI also accelerated, climbing 0.8% MoM and 3.6% YoY, well above forecasts. The surge pressures corporate margins, especially for companies lacking pricing power, and may influence inventory cycles and earnings revisions. Market reactions, particularly in bonds and high-multiple equities, often precede headline recognition, highlighting the importance of liquidity signals. Source: Bloomberg TV @BloombergTV