BREAKING: China has opened antitrust investigations into Nvidia and Google just hours after imposing 10%-15% tariffs on some US imports, per FT.
China is reportedly looking for new trade war leverage against President Trump. Source: FT

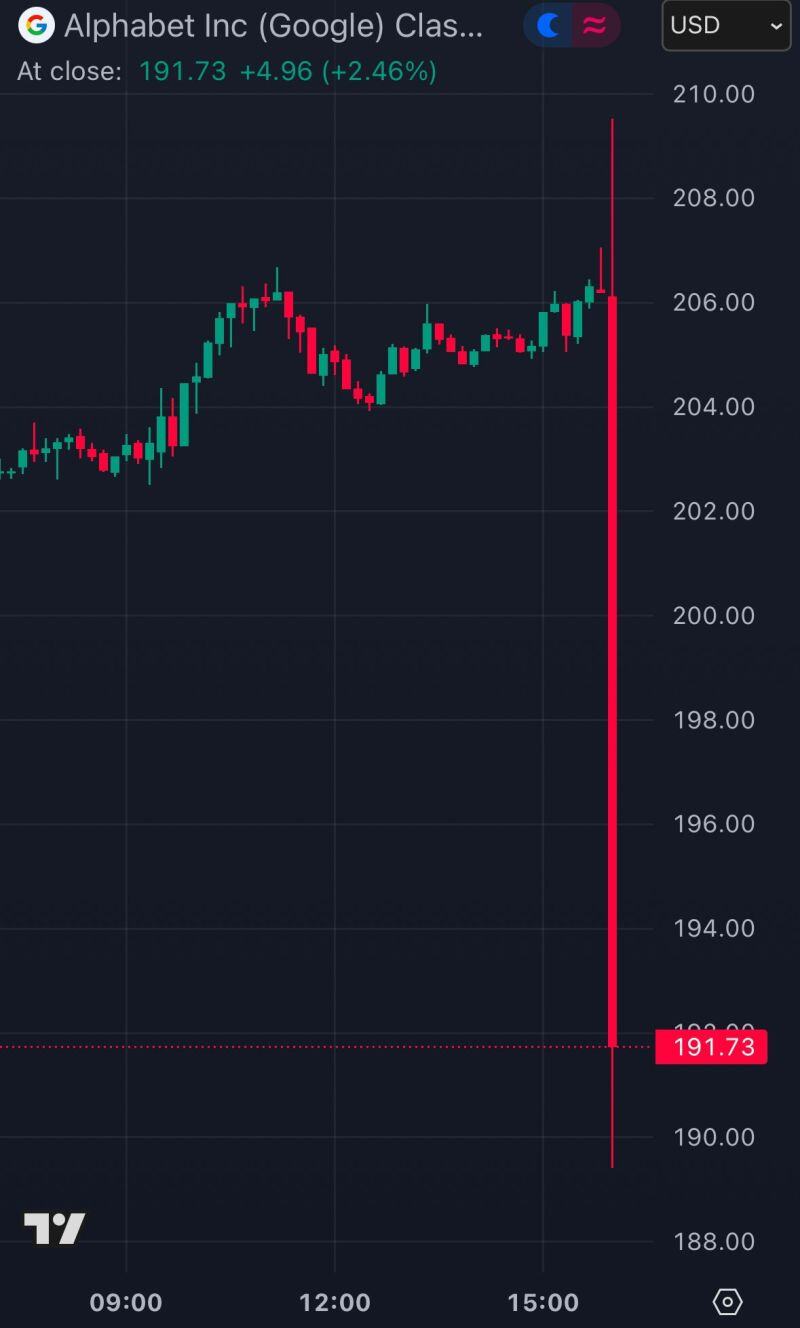
BREAKING: Alphabet stock, $GOOGL, falls over -7% after reporting Q4 2024 earnings.
Source: The Kobeissi Letter
JUST IN 🚨: Gold jumps to a new all-time high and has now made fresh all-time highs in 5 consecutive trading sessions
Source: Barchart

This is the most important datapoint in earnings season so far.
Alphabet to invest $75 billion in CapEx during 2025 - this will ease chip industry fears. Large cap tech is maintaining record investment in AI infrastructure, even after DeepSeek’s disruption. Source: The Kobeissi Letter

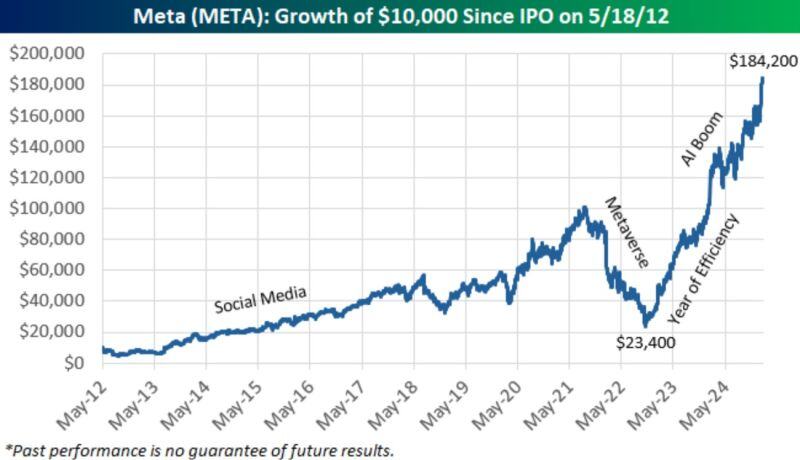
As Facebook turns 21, here's a look at the growth of $10k in $META since its IPO in May 2012.
As a reminder, this stock saw a 76% drawdown from late 2021 to late 2022. It has rallied nearly 700% since its 2022 low. source : bespoke
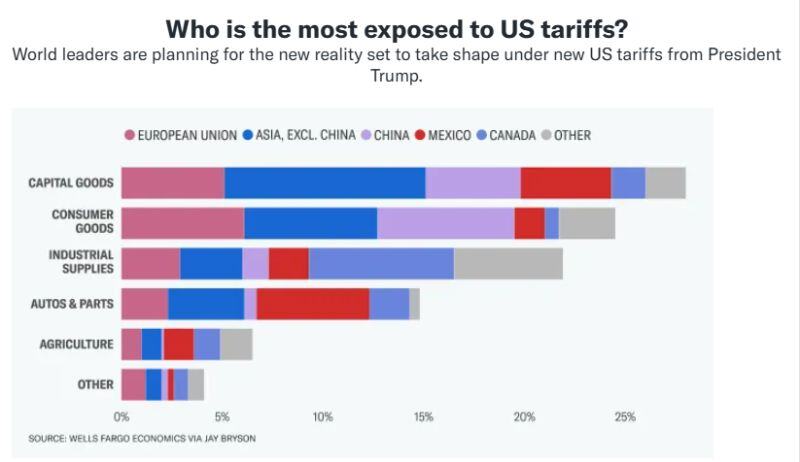
Who is the Most Exposed to US Tariffs
source : yahoo!finance
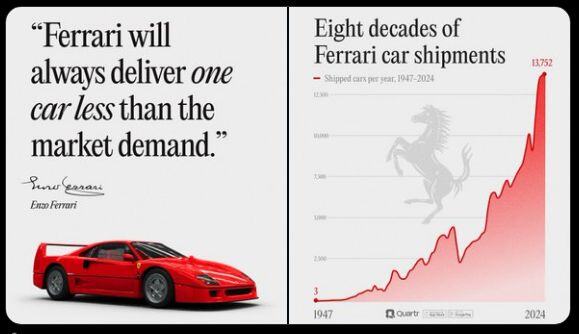
Ferrari $RACE Q4 2024 results
"Quality of revenues over volumes: I believe this best explains our outstanding financial results in 2024" – Benedetto Vigna, CEO. Shipments +2% *EMEA +4% *Americas +8% *Greater China -21% *APAC +5% Revenue +14% EBIT +26% *marg 27% (24.4) EPS +32% Source: Quartr
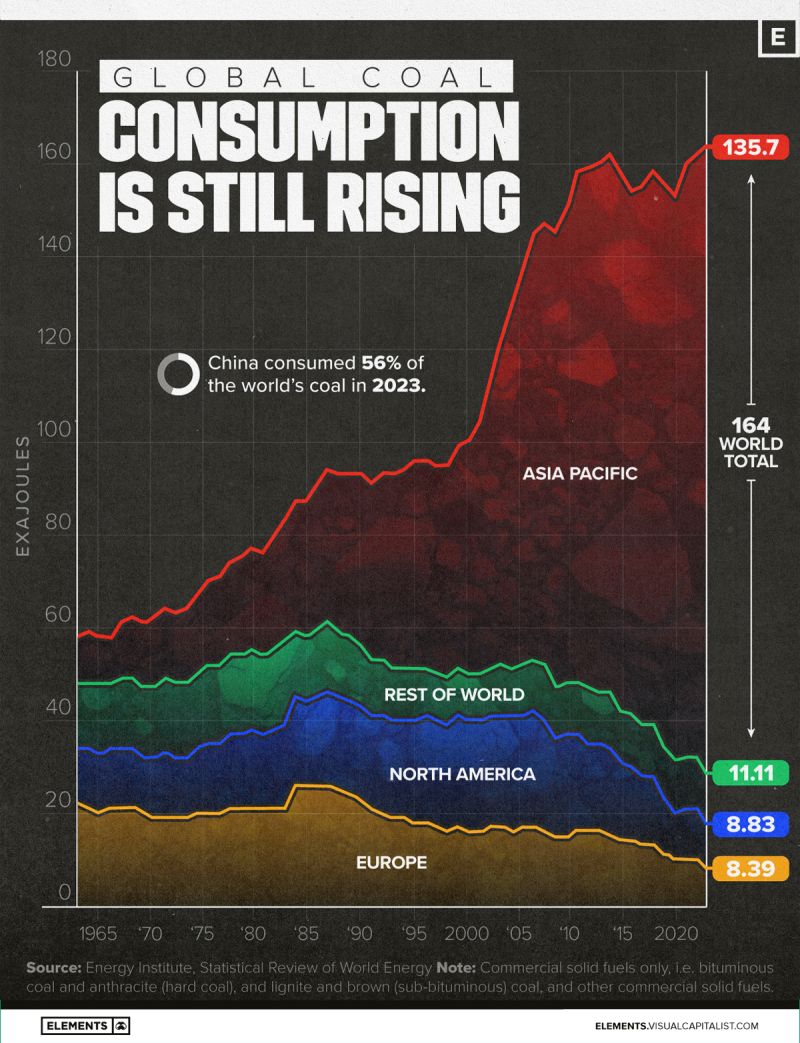
Visualizing the Rise in Global Coal Consumption ⚡️
Source: Elements