Great column in the FT
France and Britain are changing places "Britain and France are sitting on opposite ends of a political see-saw. Three days after the UK elected a pragmatic, centrist government with a huge majority, France went to the opposite extreme. Sunday’s legislative elections have produced a deadlocked parliament, with both the far right and the far left gaining ground. (...) Relief that the far-right Rassemblement National performed worse than expected in the second round of voting cannot disguise the fact that the centre ground in French politics is shrinking — and with it the authority of President Emmanuel Macron. The calm of London on election night last week contrasted strongly with the fevered atmosphere in Paris on Sunday evening. (...) it may be many months before France has a government that is capable of delivering a coherent response on European questions. That will be a problem, not just for Britain but for the whole of the EU," LINK TO THE ARTICLE >>> https://lnkd.in/eaMy_zCQ

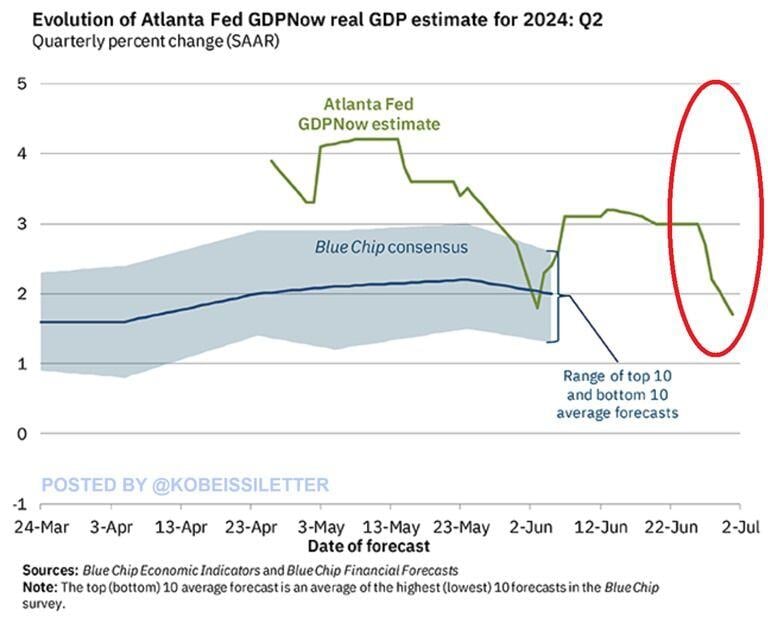
US GDP growth estimates are plummeting: The most recent Atlanta Fed estimate for real US GDP quarterly growth in Q2 2024 is down to 1.7%.
This estimate is down from 4.2% seen in mid-May and from 2.2% seen on June 28th. If this estimate turns out to be correct it will be the 2nd consecutive quarter of GDP growth below 2.0% after Q1 2024 GDP of 1.4%. Is the US economy finally slowing down? Source: The Kobeissi Letter
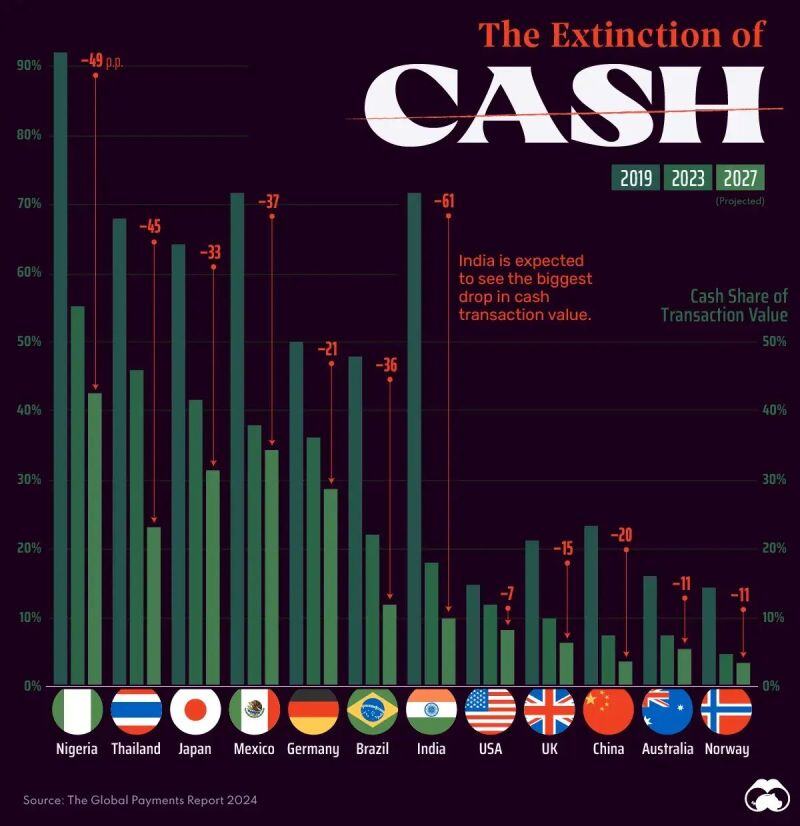
Cash Transactions are becoming increasingly rare around the world
Source: Visual Capitalist
Invest In Assets
SWOT analysis for business analysis:

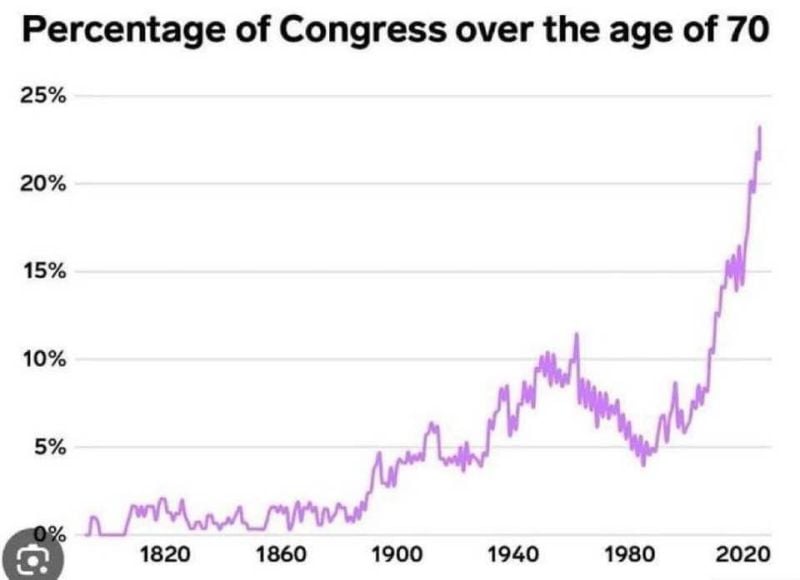
Percentage of Congress over the age of 70
.
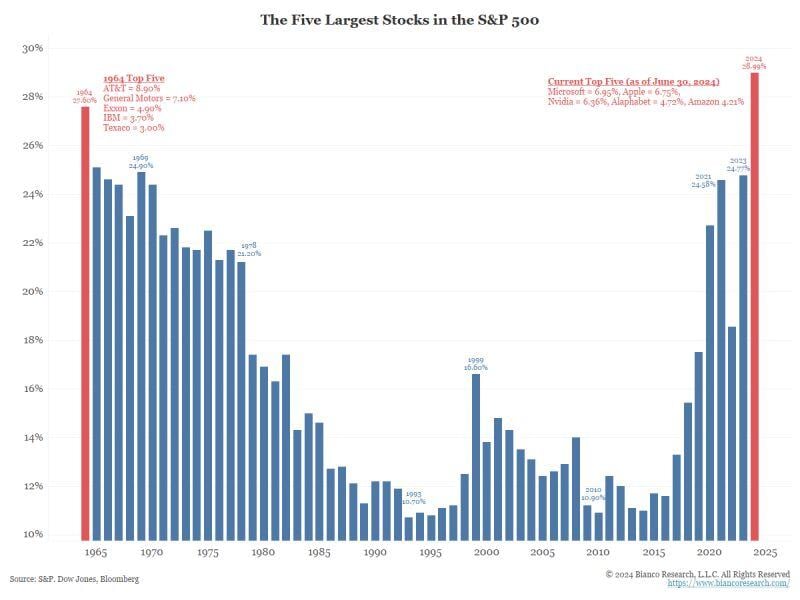
S&P500 concentration at the highest level in at least 60 years: 5 largest stocks within S&P 500 = 28.99%
As mentioned by Jim Bianco: The risk of the current S&P500 concentration is that one day the opposite happens: five stocks could kill the index funds while everything else outperforms... "Restated, one buys an index fund to get diversification. But with record concentration, they are not getting it". Source: Bianco Research
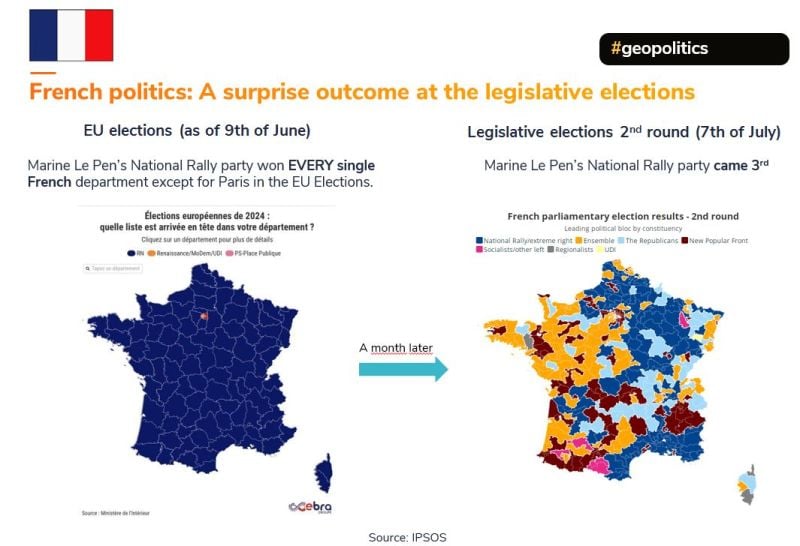
The far-right RN was defeated yesterday but the problem is far from over.
They got 37% of the popular vote. 37% !! The "winning left" got 26%... Note 2 things: 1) The specificities of the French lower house voting system: One party rises from 33% to 37% between the 2 rounds and move from rank #1 to rank #3. Another one (left / far left) declines from 28% to 25% a move from rank #2 to rank #1 2) If you take out far-right RN and far-left/left, the true "traditional / establishment" parties are less than 30% of votes... (despite unprecedented turnout) Source image: JohannesBorgen

A month in French politics...
4 weeks ago, Marine Le Pen’s National Rally party won EVERY single French department except for Paris in the EU Elections. Yesterday, Marine Le Pen’s National Rally party came 3rd... How to explain this? - The specificities of the lower house voting system (2 rounds) - The coordinated anti-RN strategy, under which the left and centre tactically withdrew their candidates from run-off ballots - Or just an ungovernable country?