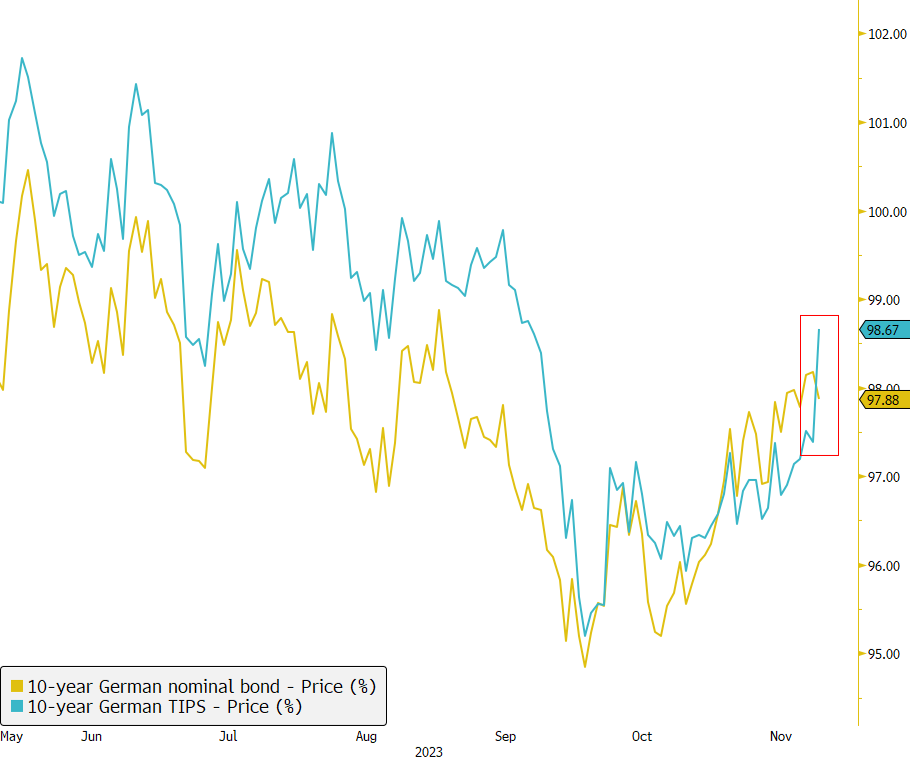
Market Moves: 10-Year German Inflation-Linked Bond Surges
Today witnessed a significant market shift as the 10-year German inflation-linked bond surged by more than 1%, juxtaposed with a 0.5% drop in the 10-year German nominal yield. This move can be attributed to the recent announcement from the German Federal Government to cease sales of inflation-linked bonds starting from 2024. Additionally, Germany's Lindner announced today to suspend the debt limit (#debtbrake) for 2023 following a budget ruling. Source: Bloomberg
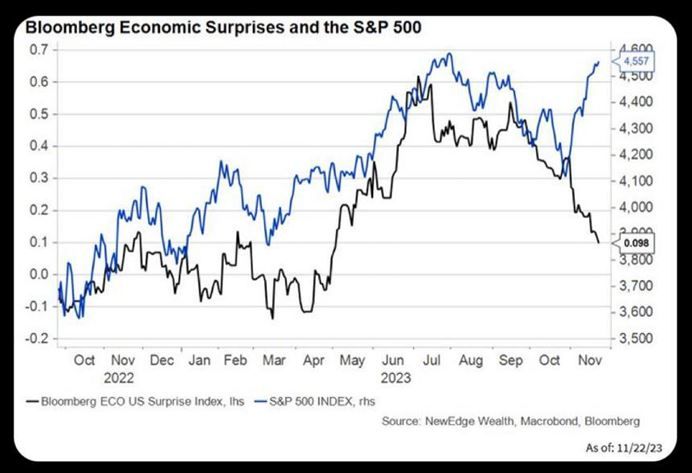
The "bad (macro) news is good (market) news" in one chart
Source: Michel A.Arouet, Bloomberg
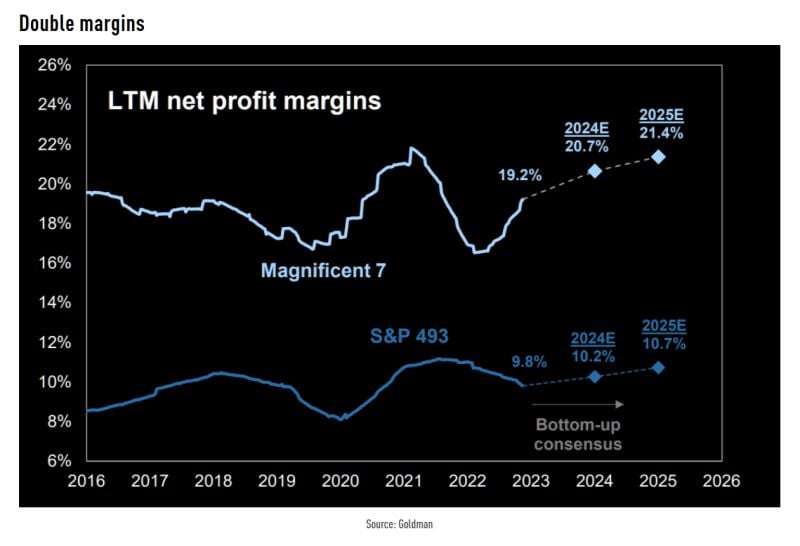
Consensus expects Net margins for the Magnificent 7 to stay significantly higher than the rest of the S&P 500
Source: Goldman Sachs, TME
Hedge Funds betting on a decline in US and European stockmarkets have suffered an estimated $43bn of losses in a sharp rally over recent days.
Short sellers, many of whom had built up bets against companies exposed to higher borrowing costs over the past year or so, have been caught out by a “painful” rebound in “low quality” stocks this month, said Barclays’ head of European equity strategy Emmanuel Cau. That has come as the market has grown more confident that the US Federal Reserve’s cycle of rate rises is finally over. Funds suffered $43.2bn of losses on short bets in the US and Europe from Tuesday to Friday inclusive last week, according to calculations by data group S3 Partners, which do not take account of gains that funds may have made in other stocks they own. Source: FT

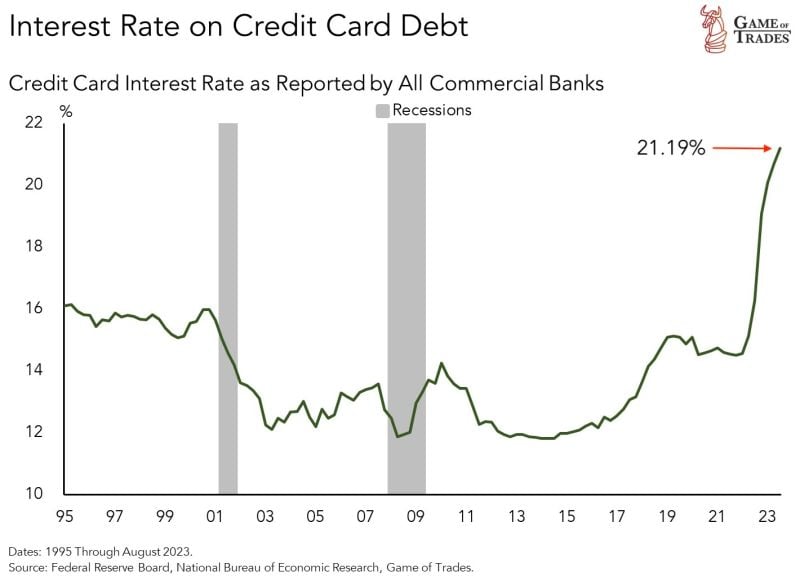
Interest rate on credit card debt has risen to 21.19%
To put this in perspective, this rate was at 14.56% in early 2022. That’s a 6% + jump in less than 2 years. Current levels have NEVER been seen in over 25 years. This is happening at a time when credit card debt has crossed the $1 trillion threshold. To make things worse, personal interest payments have crossed $500 billion. Source: Game of Trades
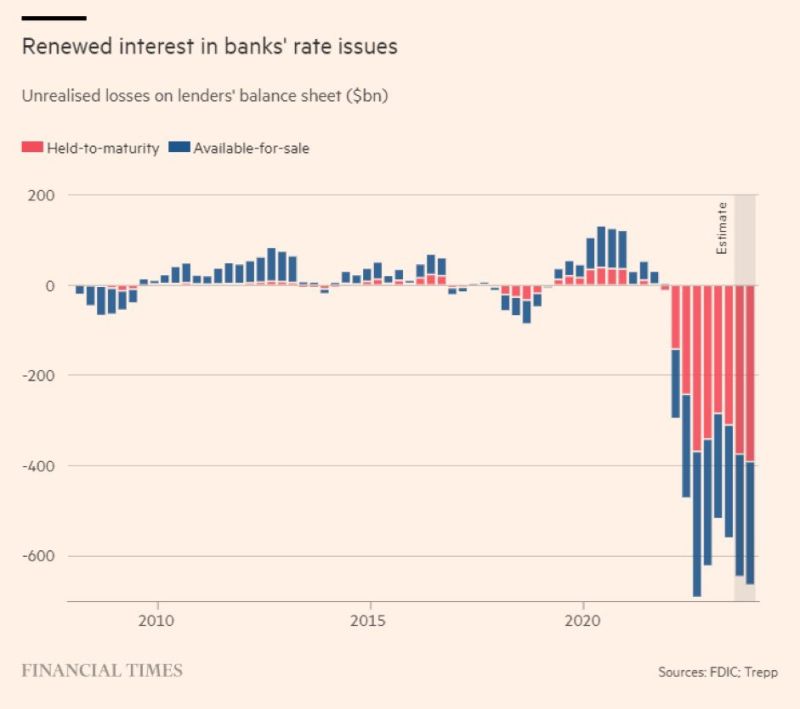
U.S. Bank Losses on held-to-maturity assets have soared to an ALL-TIME HIGH of $400 Billion! 👀
Source: Barchart, FT
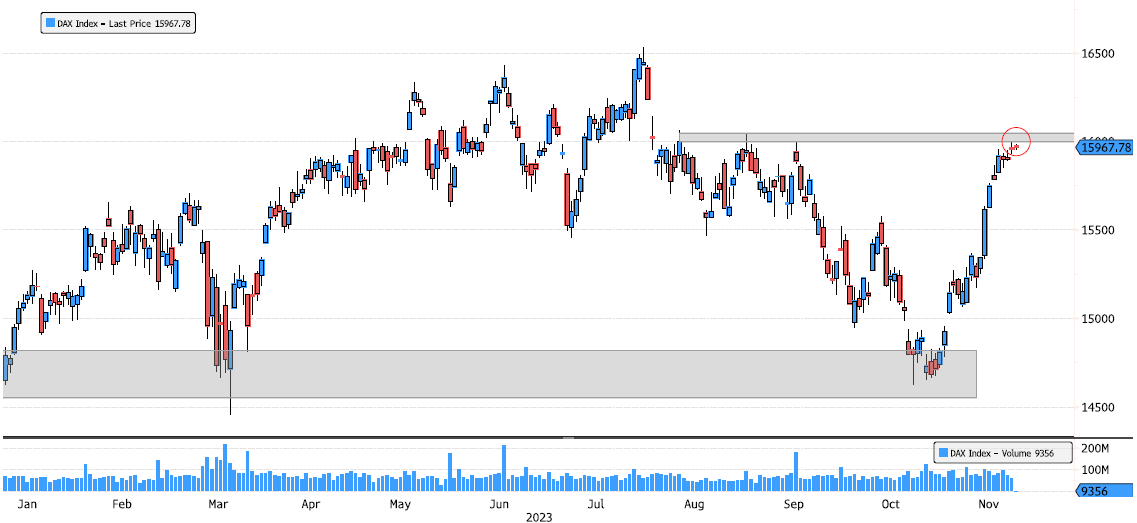
Dax Index reaching a strong resistance level
Dax Index has rebounded more than 9% since one month. It's now approaching resistance level 16'000-16'050. Source : Bloomberg
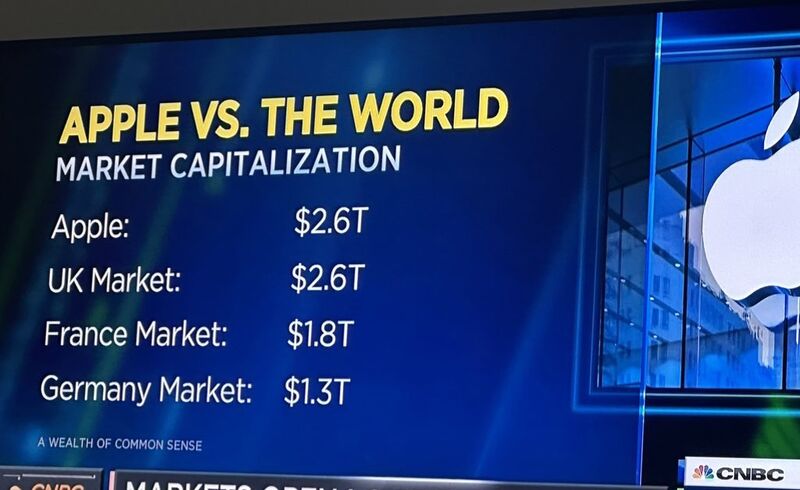
Apple vs The World
Source: Michel A.Arouet