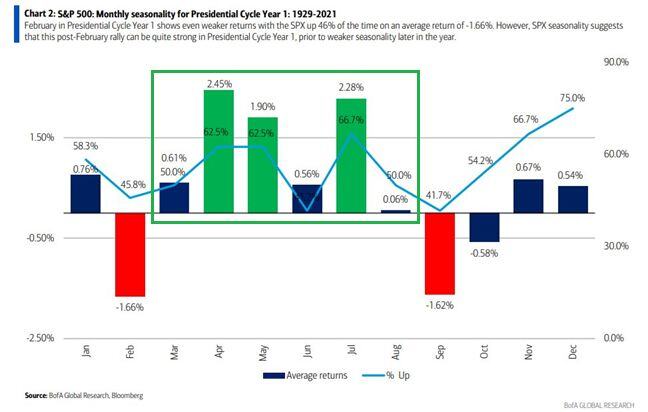
More Year 1 seasonality...
March-August pretty solid, on average. SPX 1929-2021 Suttmeier BofA. Source: Mike Zaccardi, CFA, CMT 🍖 @MikeZaccardi
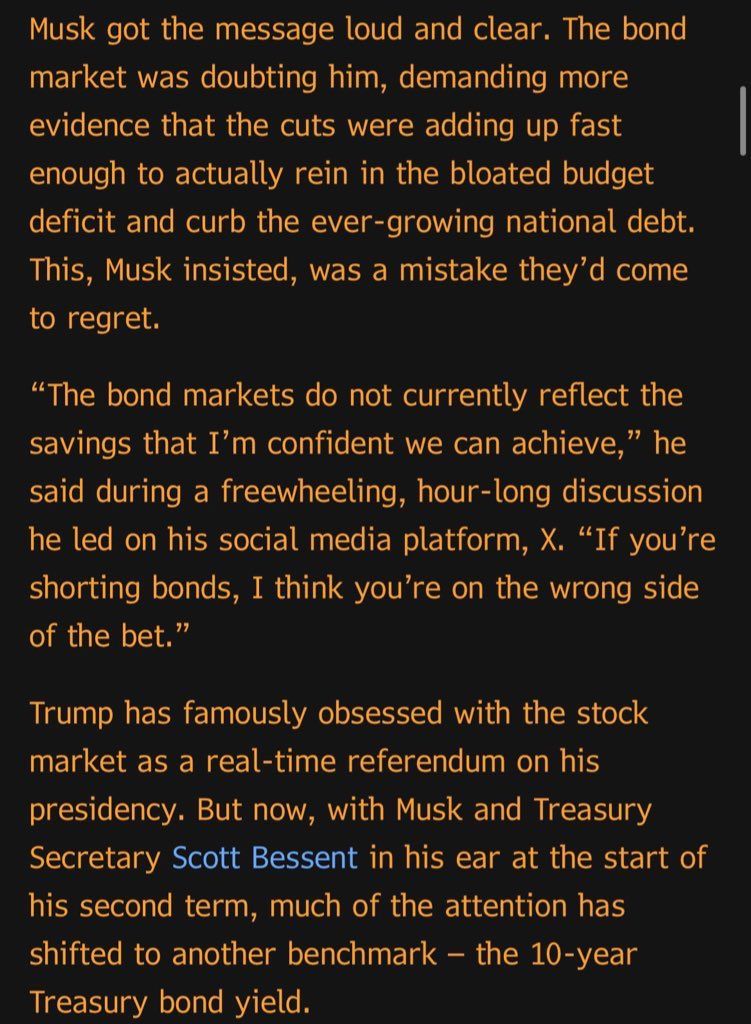
The Trump 1.0 put was on equities $SPY
Will the Trump 2.0 put be on us treasuries $TLT ??? Source: Geiger Capital @Geiger_Capital on X, Bloomberg
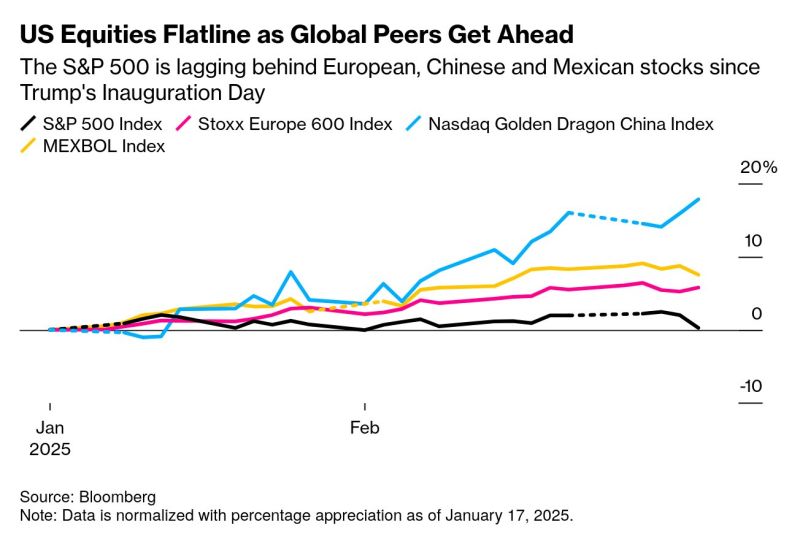
The S&P 500 has lagged behind Chinese, Mexican and European stocks since Trump's inauguration 👀
Source: Bloomberg
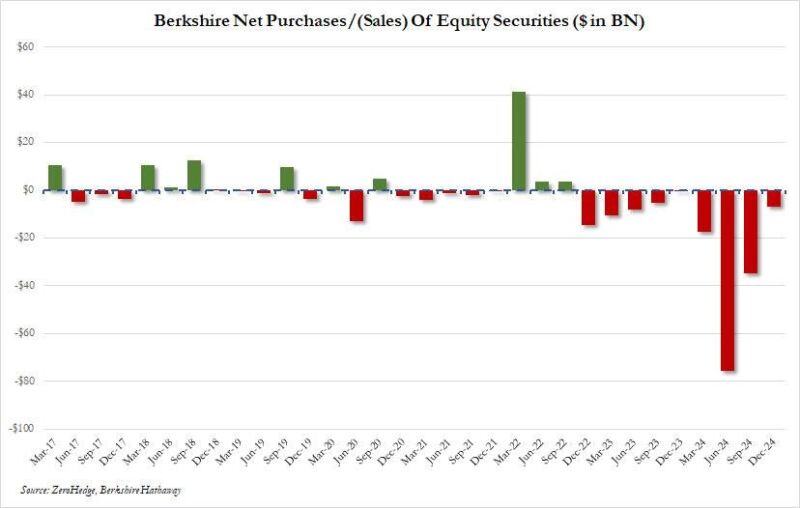
Warren Buffett has been a net seller of stocks for 9 consecutive quarters now…
(h/t @zerohedge)
While equities took a beating Friday, bonds quietly broke out—closing above 5 months of trendzone resistance.
Right into PCE week… Interesting. $TLT Source: Trend Spider

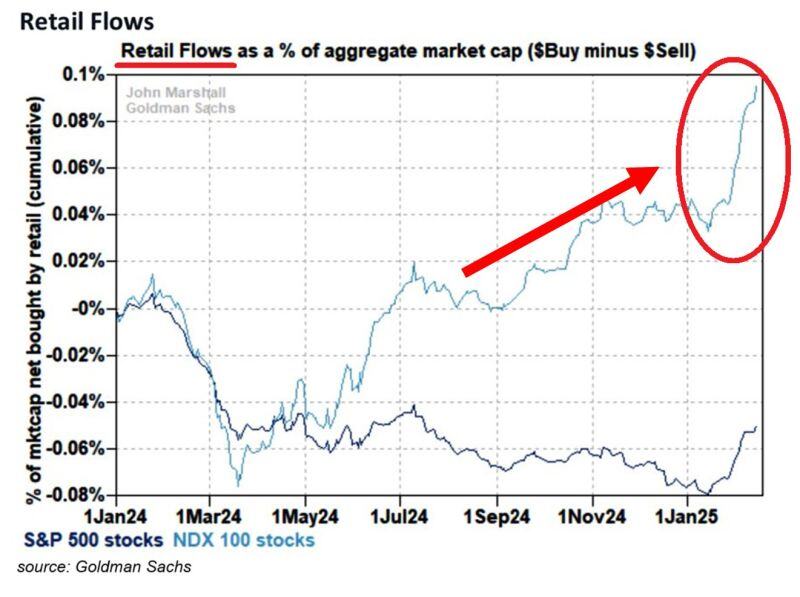
⚠️Retail investors are buying US stocks at the fastest pace on RECORD.
Mom-and-pop investors flows into technology stocks have more than DOUBLED in just a few weeks. Institutional investors selling to retail as they chase stocks at record valuations. Meanwhile, individual investors have UNDERperformed the market for 3 years in a row. Source: Global Markets Investor, Goldman Sachs
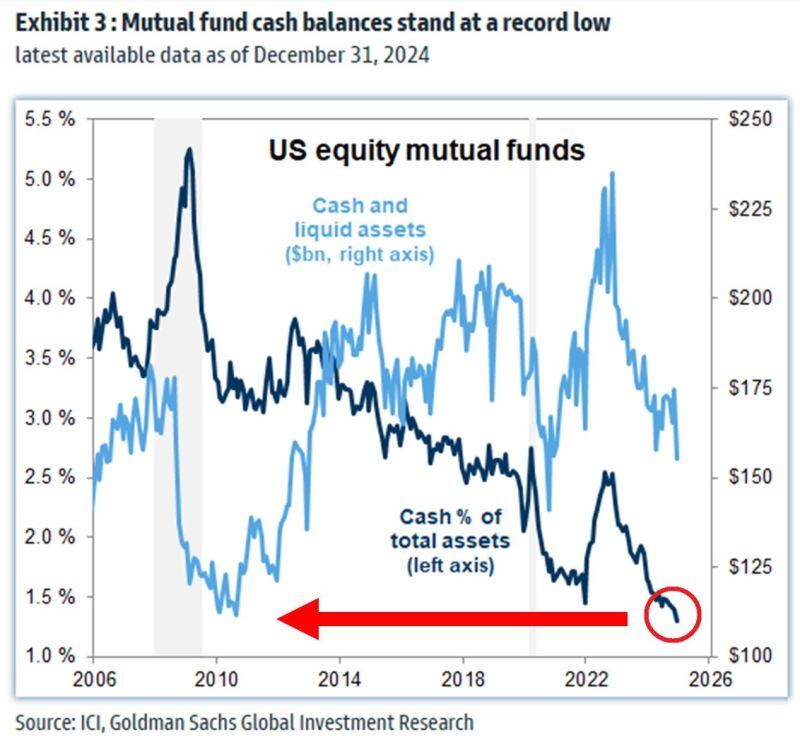
⚠️Is cash trash in this market?
US equity mutual funds cash as a percentage of total assets hit a RECORD LOW of 1.3%. Cash levels are even lower than in early 2022 when the bear market started. There is not much powder left to put into stocks anymore. Source: Global Markets Investor
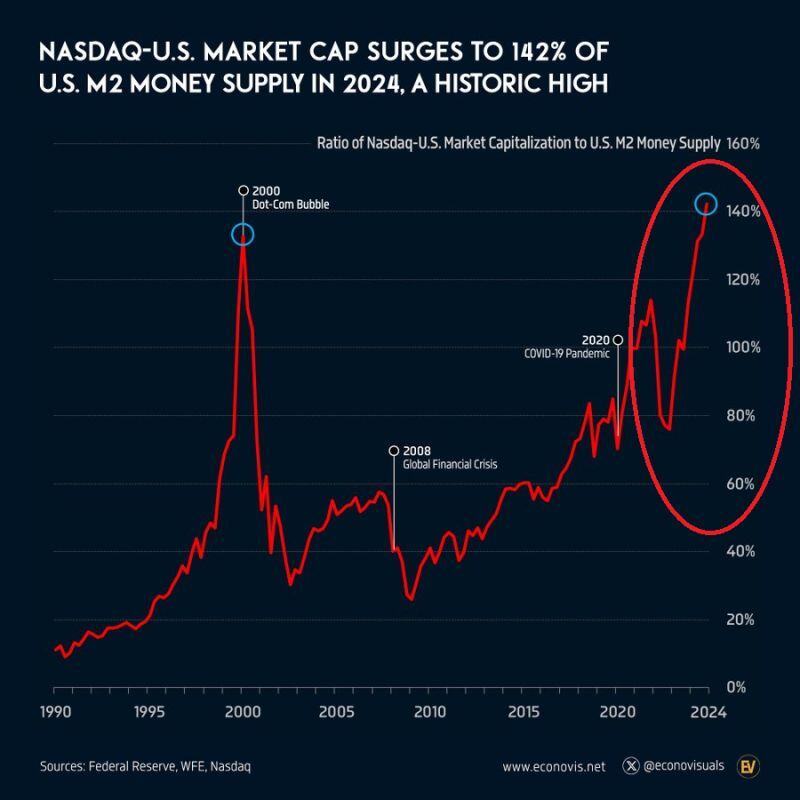
Nasdaq market capitalization to US M2 Money Supply has hit a RECORD 142%.
The ratio has DOUBLED over the last 5 years and even exceeded the Dot-com Bubble levels of ~130%. Equities rise has MATERIALLY outpaced the money supply increase. Source: Global Markets Investor