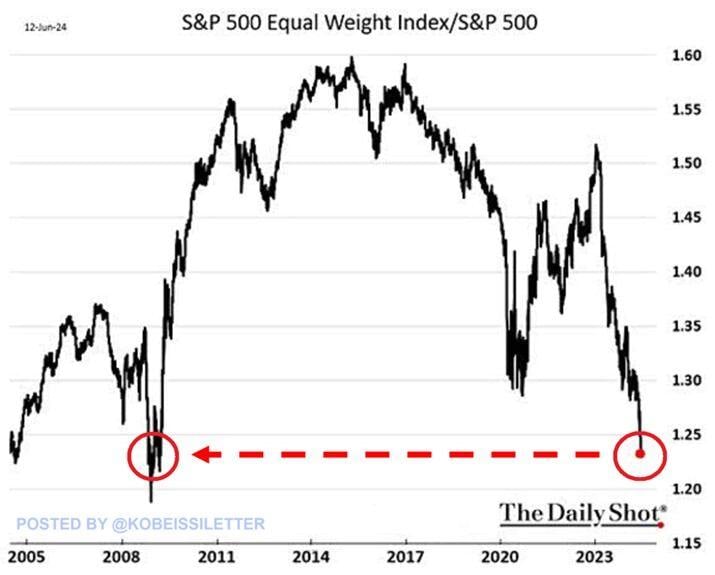
Wow. The average S&P500 stock has been on average 4.5x as volatile as the broader index!
Chart: Goldman Sachs Source: Markets & Mayhem
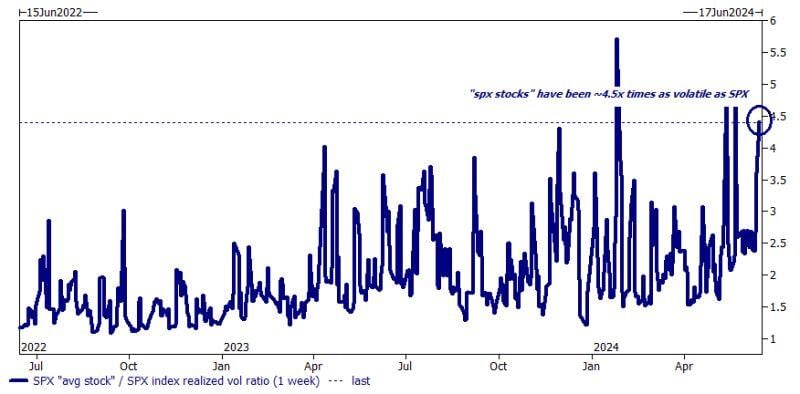
And so begins the S&P 500 buyback blackout period . . .
Source: Markets & Mayhem
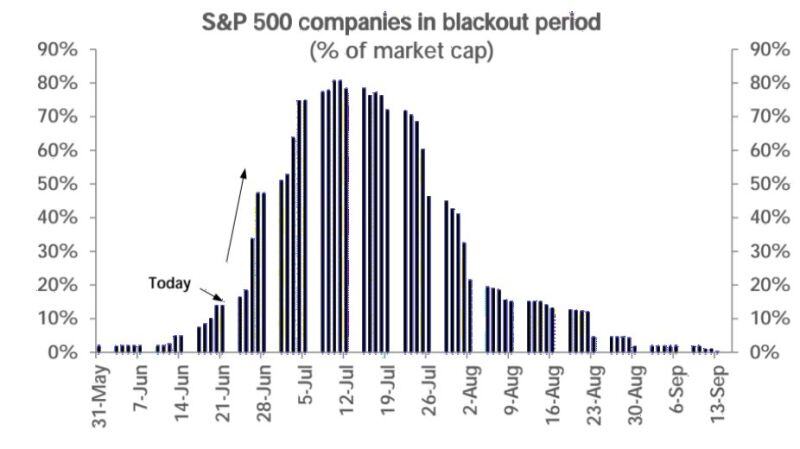
Here are the stocks driving the S&P500’s almost 15% return so far in 2024.
Source: Evan
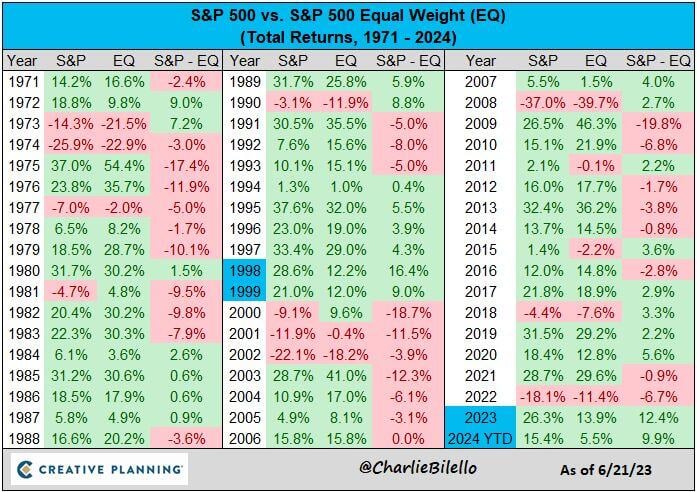
The market cap-weighted S&P 500 is outperforming the equal weight index by nearly 10% this year, following 12% outperformance in 2023.
Since 1971, the only back-to-back years with a higher combined outperformance: 1998-1999. Source: Charlie Bilello
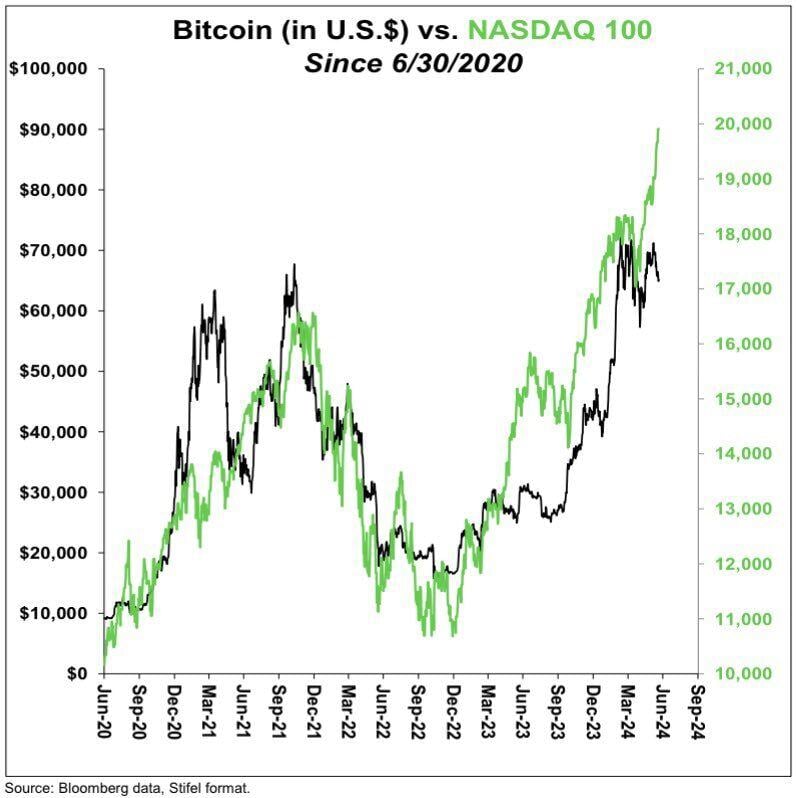
The Nasdaq 100 and Bitcoin have moved in tandem for the past 4+ years.
With the recent Tech rally, the Nasdaq is showing its largest divergence versus Bitcoin during this time frame. Will we see bitcoin catch up or Tech catch down? Source: David Marlin
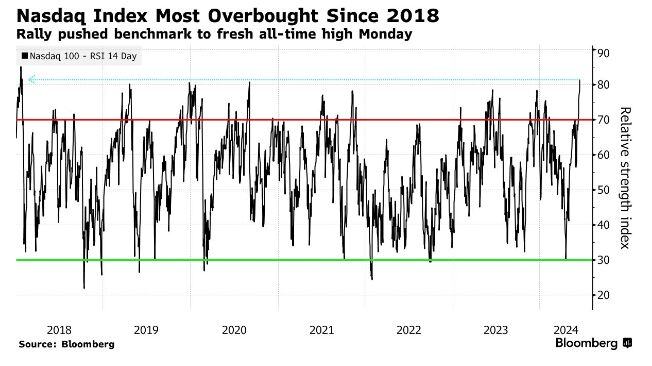
Mega Cap Tech Stocks hit their most overbought level in more than 6 years last week
Source: Barchart, Bloomberg
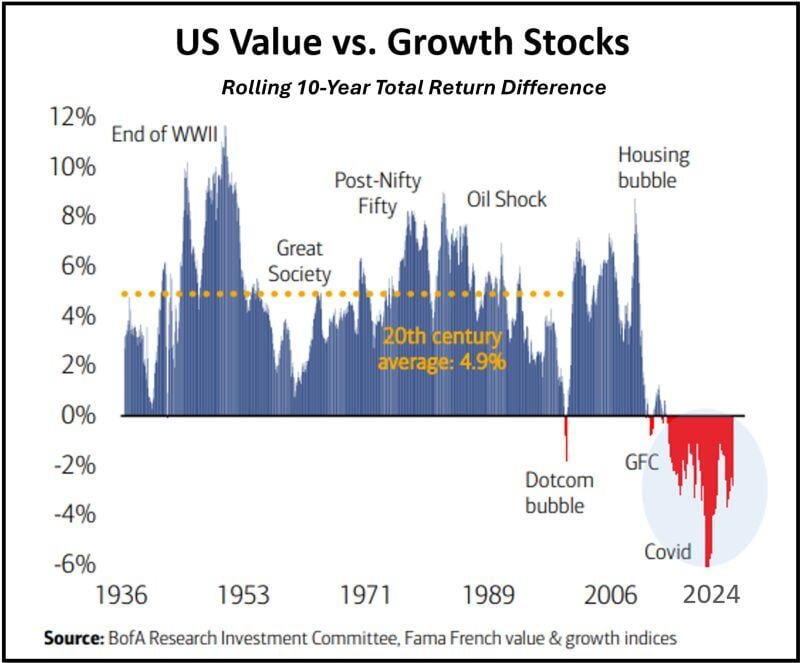
Was the recent trend of growth stocks outperforming value stocks an anomaly, driven mainly by lower capital costs that favored growth over profitability?
As shown below, history shows that US value outperformed US growth most of the time (using rolling 10-year Total Return) Source: Tavi Costa, BofA
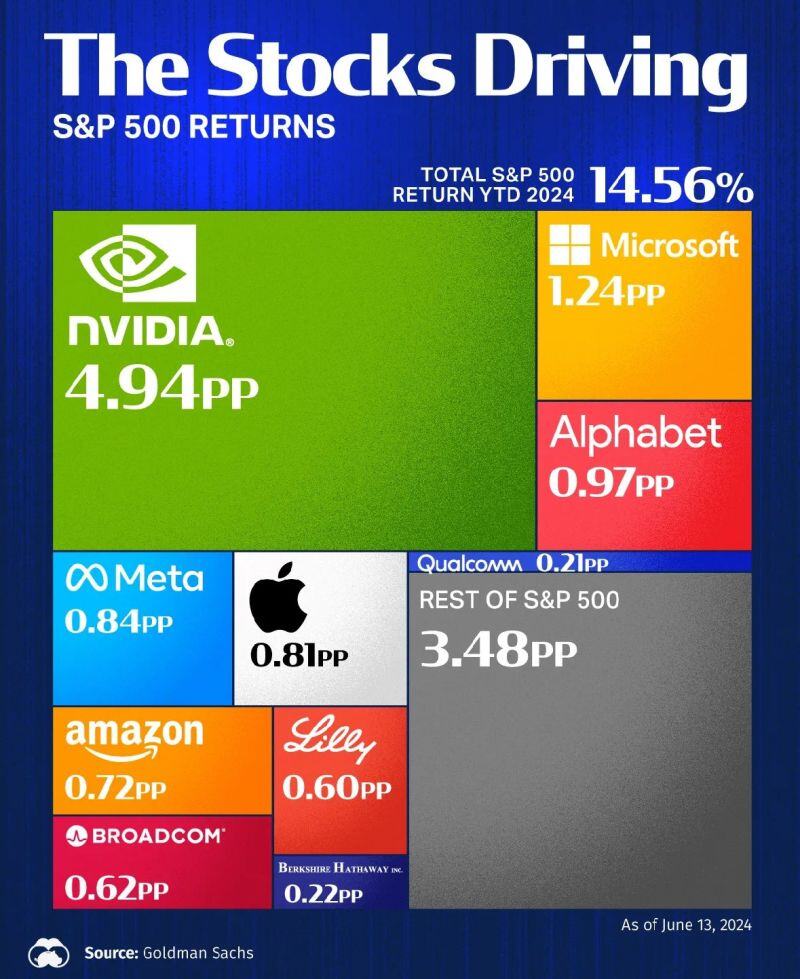
Large tech stocks just keep getting bigger: The S&P 500 Equal Weight index relative to the S&P 500 is now at its lowest level since the 2008 Financial Crisis
This ratio has accelerated as the S&P 500 has rallied by 14% year-to-date while the equal-weight by just 5%. The disconnect has been driven by the 5 largest stocks which have seen a 32% gain combined this year. Since January 2023, the S&P 500 is up a massive 41% while the equal-weight index is up just 16%. At the same time, Russell 2000 Equal Weight is nearly flat, up just ~3%. Source: The Kobeissi Letter, The Daily Shot