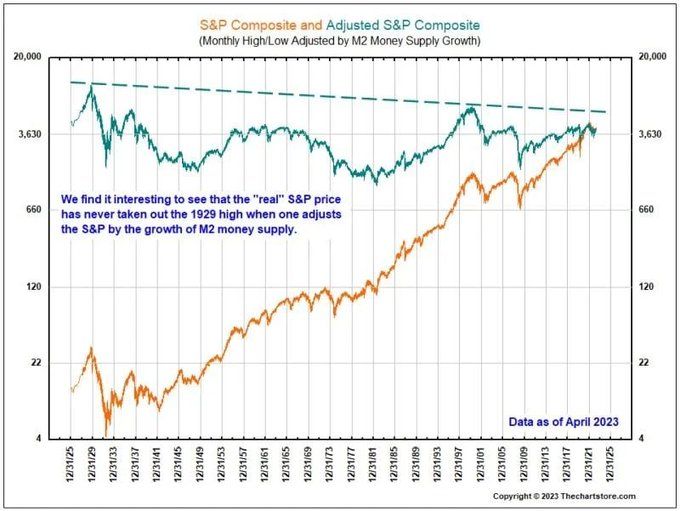
The real price of the S&P500 has never exceeded the 1929 highs...
...If adjusted for M2 money supply growth 💸 Source. Nicolas Cheron
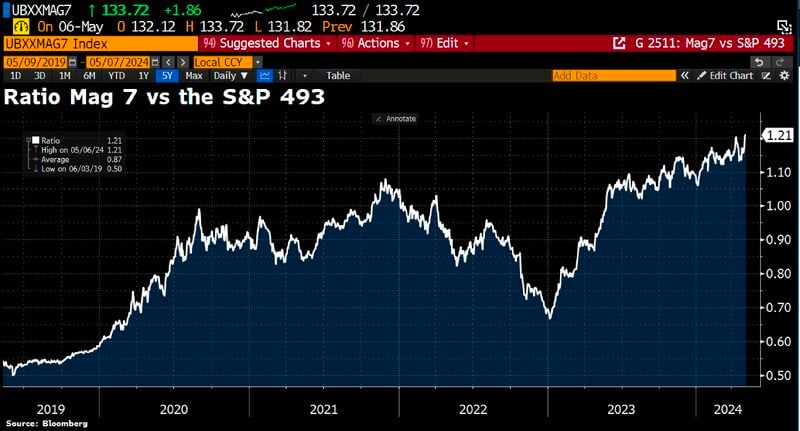
Don't fight the Mag 7?
The ratio of the Mag 7 vs the S&P 493 (S&P 500 ex Mag 7) has just hit another ATH. Source: Bloomberg, HolgerZ
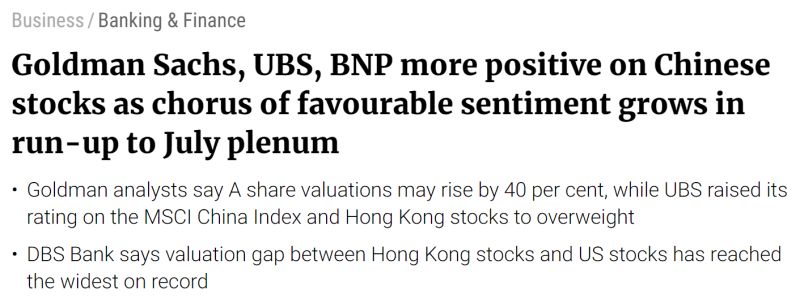
Wall Street is turning less negative on China stocks
Source: Daily Compounding
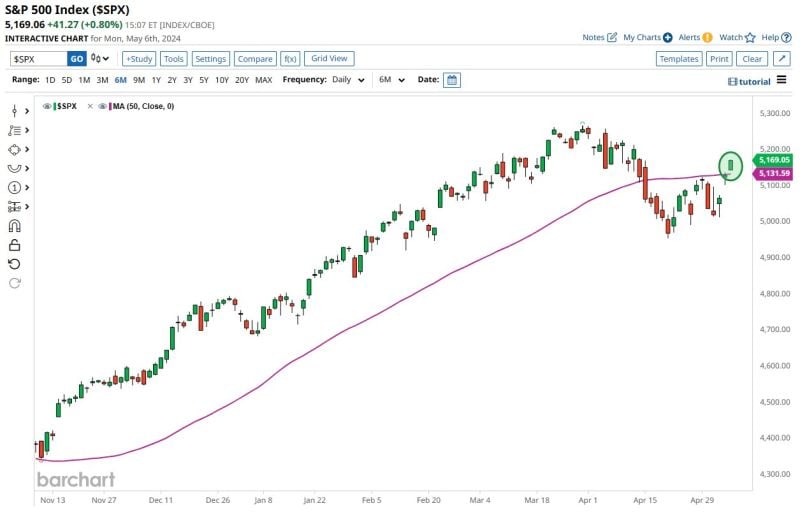
The S&P 500 $SPX - it has now reclaimed its 50D moving average
Source: Barchart
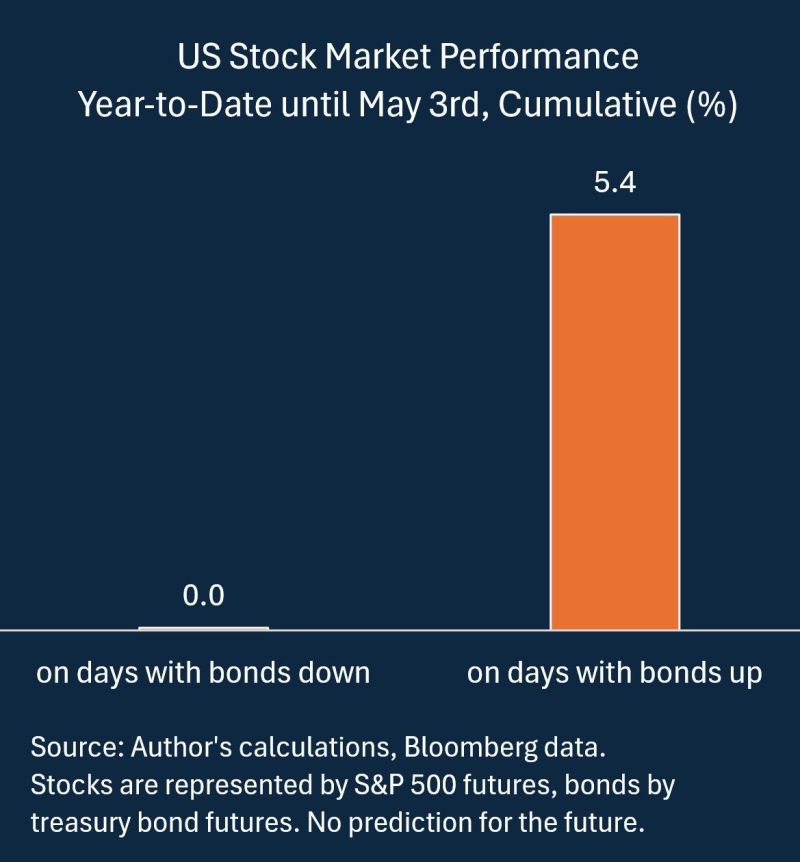
Great observation by Dr. Michael Stamos, CFA - Head of Global Research & Development of Global Multi Asset Department at Allianz Global Investors
-> "On days when bonds were up, stocks tended to go up as well. When bonds fell, stocks managed to stay at least flat. Overall it was a pretty nice environment for equity investors. Lets hope this doesn't turn into a high-correlation-when-markets-are-down type of environment".
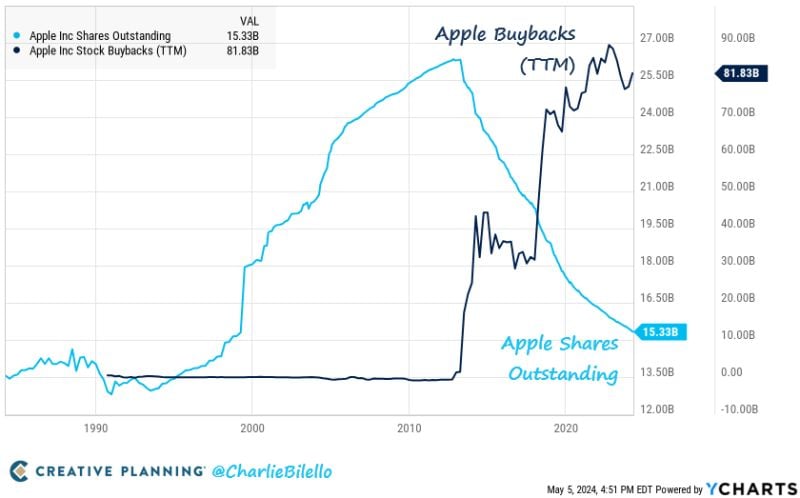
Apple has bought back $625 billion in stock over the past 10 years, which is greater than the market cap of 492 companies in the S&P 500.
$AAPL Source: Charlie Bilello
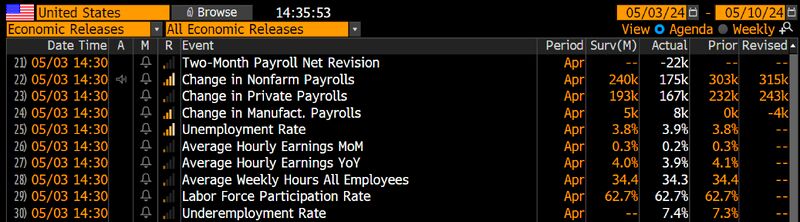
Stocks, bonds and cryptos rally following soft US jobs data.
Hiring slows to 175,000 jobs in April way below the forecasted 240k. This is the lowest figure since Oct 2023’s +165k. Household survey came in below forecasts as well with unemployment rate rising to 3.9% from March's 3.8%. Wage growth slows to 0.2% MoM vs 0.3% expected. Note that 0.2% is consistent with 2% inflation. Source: Bloomberg, HolgerZ
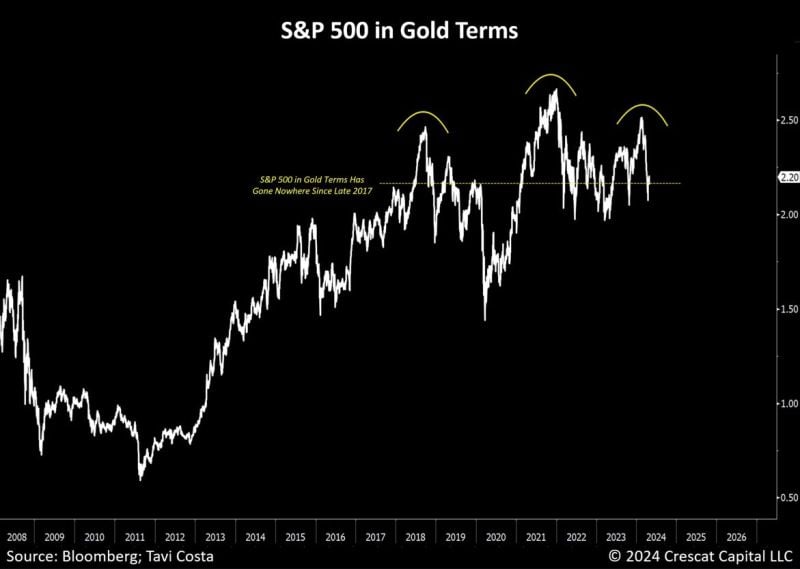
The SP500 in gold terms has gone nowhere since 2017 + it’s hard to ignore this massive head and shoulders taking shape.
Source: Tavi Costa, Bloomberg