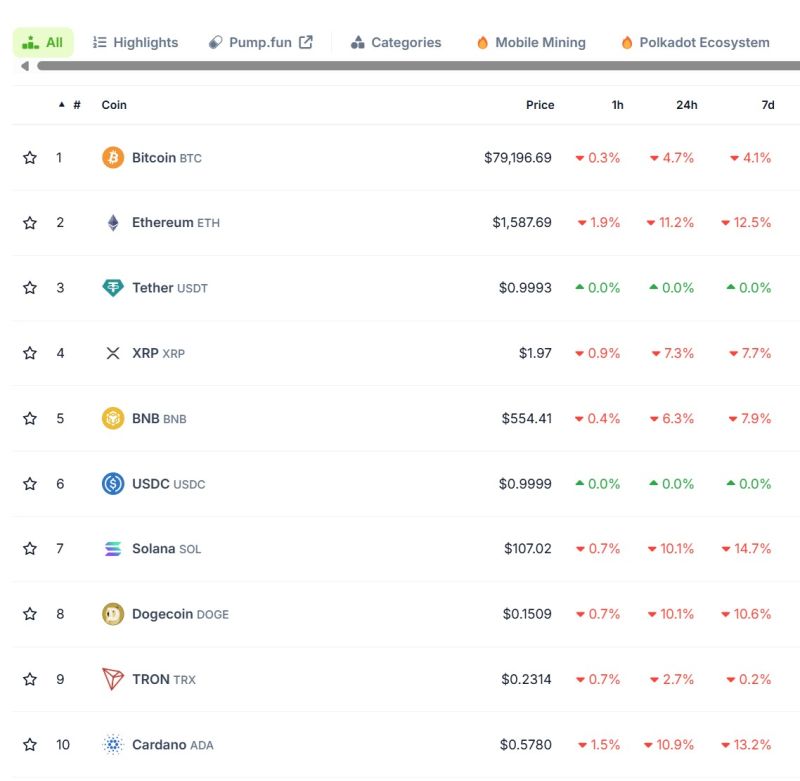
A sea of red in crypto markets ahead of Asian opening. Doesn't smell good...
,
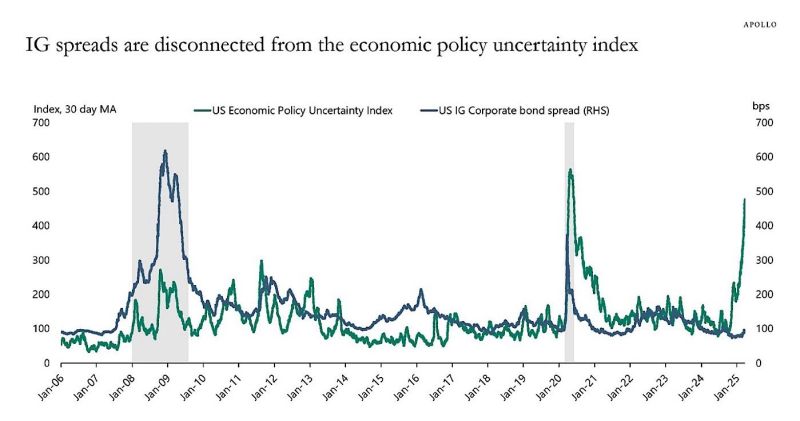
We need to monitor corporate spreads very closely
Source: Apollo
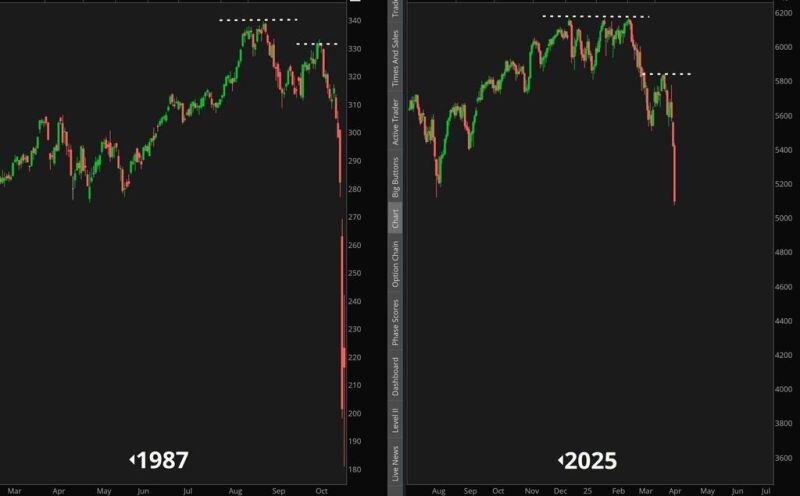
Black Monday is in everyone's mind...
because it gapped lower after the week-end that followed an aggressive sell-off Source: Jesse Cohen
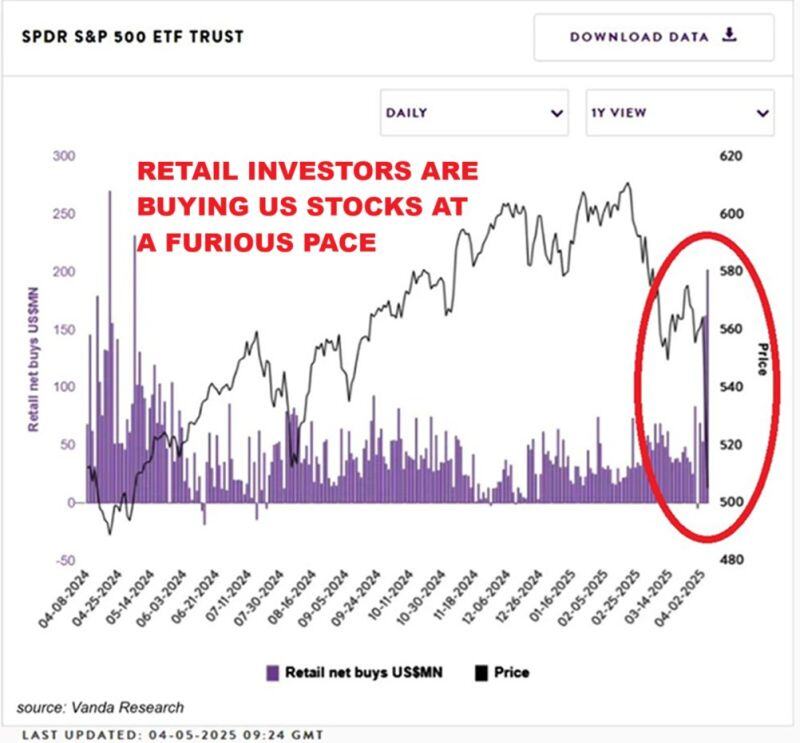
⚠️No major CAPITULATION from retail investors YET:
Net retail buying of the S&P 500 ETF, $SPY, hit over $200 BILLION on Friday, the most in 13 months. Mom-and-pop investors were also the net buyers of NVIDIA, $NVDA, Tesla, $TSLA, and Amazon, $AMZN, among others. Source: Global Markets Investor
Types of analyst one should be
The Investing for Beginners Podcast @IFB_podcast
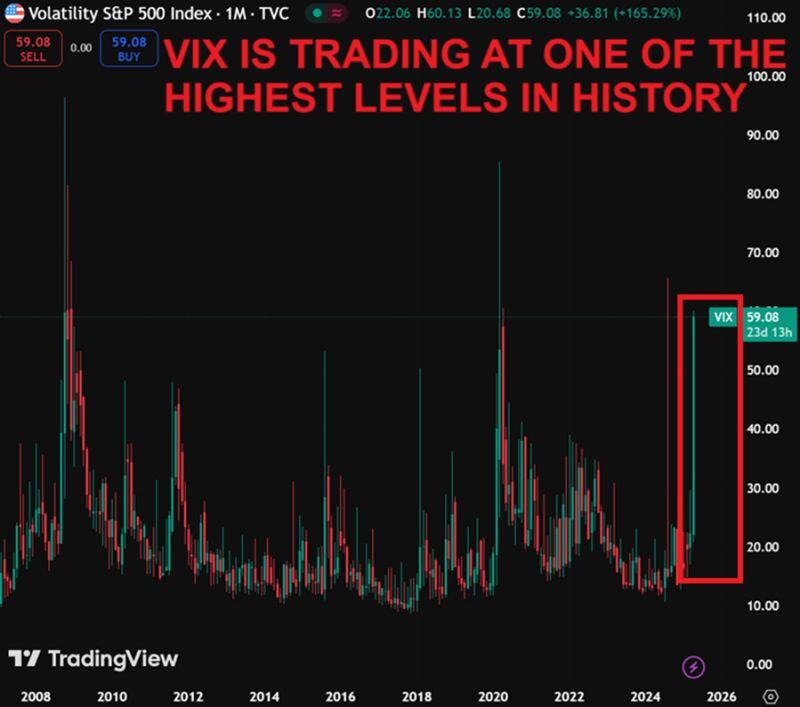
🚨Market volatility is skyrocketing as if there is A FINANCIAL CRISIS
The Volatility Index, $VIX, spiked to 59 points, the 4th highest level EVER. There were only three times when the VIX traded higher: - Great Financial Crisis - 2020 Crisis - August 2024 Flash Crash Meanwhile, the S&P 500 futures are crashing 5% in the session and are trading 22% below the peak (which means it is now in BEAR MARKET territory). Source: Global Markets Investor
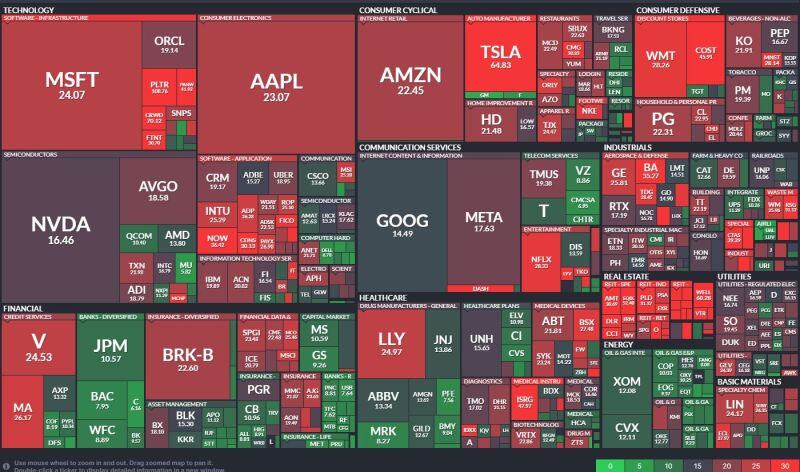
$NVDA now 16.5x earnings
$GOOGL a P/E under 15x $AAPL $AMZN are almost market multiples Source: Mike Zaccardi, CFA, CMT, MBA
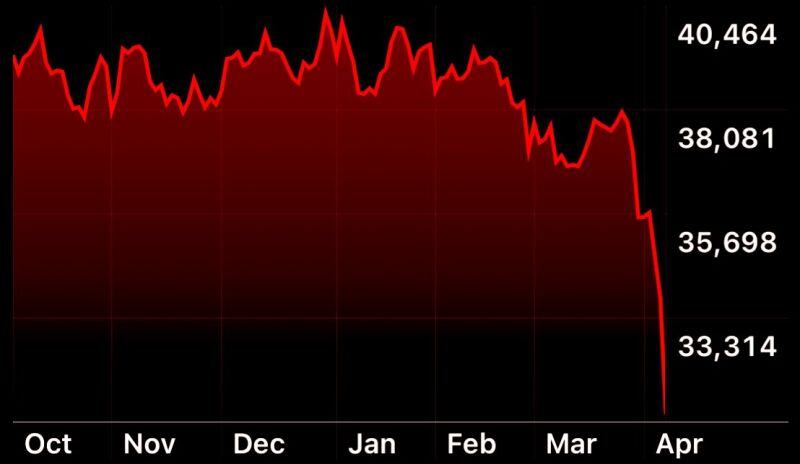
No, this isn’t a crypto meme coin…
It’s the Japanese stock market. Source: Geiger Capital