
US inflation eased further in June w/core & headline coming in each at 0.2% MoM (v.s 0.3% expected).
Headline CPI slowed to 3% YoY vs 3.1% expected (and lowest since March 2021), core dropped to 4.8% YoY vs 5% expected. This is the 12th straight month of YoY declines in headline CPI - equaling the longest streak of declines in history (since 1921)... Source chart: Bloomberg
Market Behaving Like Past Decade's Pattern Has Been Broken
Going back to 1950, this is currently the 9th longest stretch without the S&P 500 making a new all-time high. Source: Willie Delwiche
SP500 top 10 weights - market cap vs. earnings contribution
Source: J.P.Morgan Asset Management
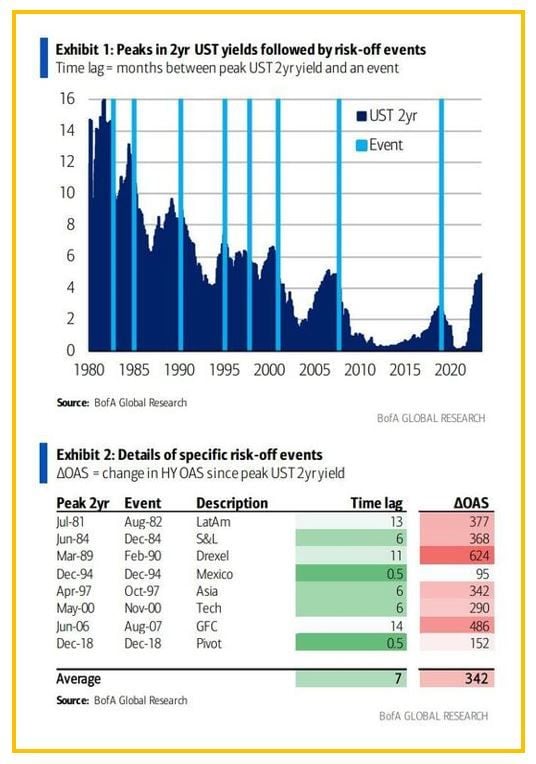
These charts by Bank of America show that every single episode of a local peak in UST 2yr yield was followed by some risk-negative event over the past 40 years.
These #charts by Bank of America show that every single episode of a local peak in UST 2yr yield was followed by some risk-negative event over the past 40 years. Such episodes ranged from mild (Mexican peso crisis in Dec 1995; HY +95bp) to moderate (Asia FX crisis in Oct 1997; HY +350bp ) to severe (GFC; HY all-time wides). The lag between the peak in 2yr yield and subsequent event varies from just a couple of weeks to just over a year, with an average being 7 months. Source: BofA, www.zerohedge.com
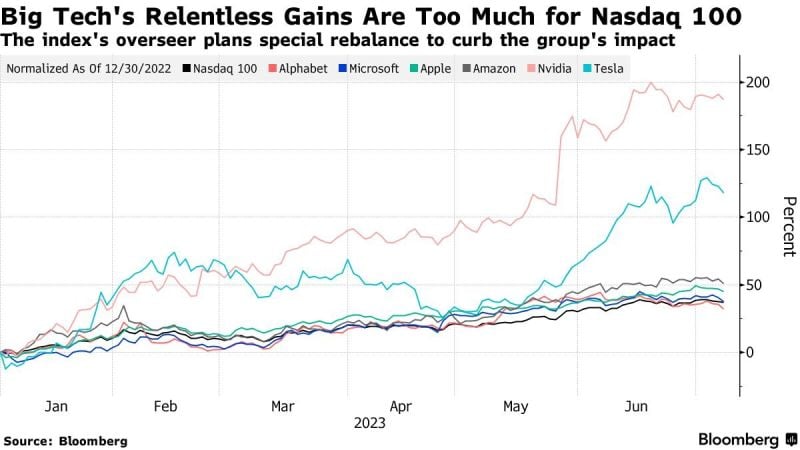
Nasdaq has announced a "special rebalance" for the Nasdaq 100
Nasdaq has announced a "special rebalance" for the Nasdaq 100 to address the overconcentration and weight that the biggest tech companies have on the index. This is the first ever "special rebalance" carried out by the overseer of the index. Source: Bloomberg
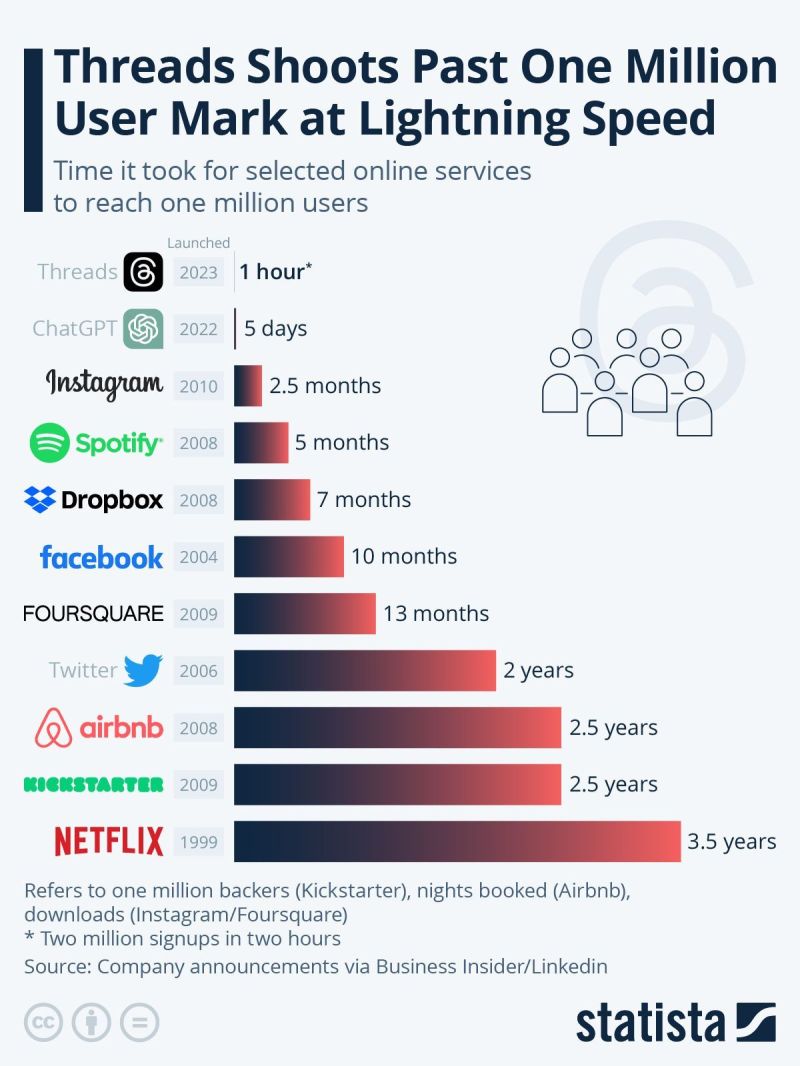
Instagram’s "Threads" surpasses 100 million users
Instagram’s "Threads" surpasses 100 million users. It just became the fastest company to attract 1 million users of any company EVER (including #ChatGPT). Source: Statista
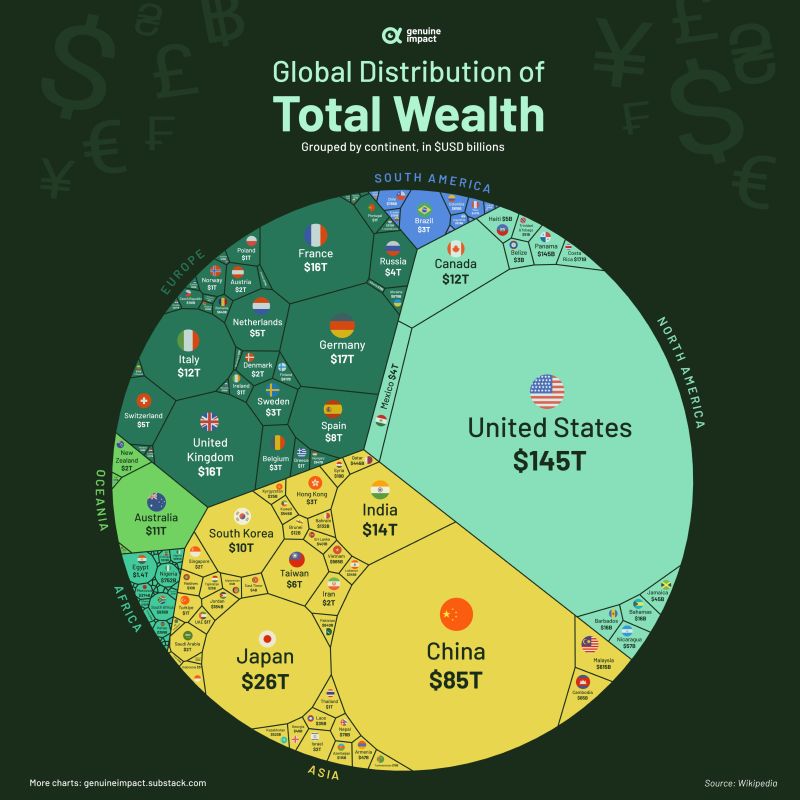
Global Distribution of Wealth
The United States is the country with the most of wealth in the world. In fact, seven countries account for 69% of the world's wealth. These seven countries are the United States, China, Japan, Germany, the United Kingdom, France, and India. Source: Genuine Impact
Manufacturing Construction Spending in the US continues to hit new highs, increasing 76% over the last year
Manufacturing Construction Spending in the US continues to hit new highs, increasing 76% over the last year - Source: Charlie Bilello 'Commerce Department figures show that spending on manufacturing structures came to nearly 0.5% of gross domestic product—the most since 1991. In the second quarter, that GDP share looks destined to be higher. Chalk it up to the CHIPS and Science Act and the Inflation Reduction Act, both passed in August last year.' - WSJ
