Among the famous Charlie Munger quotes
Source: Ticker History
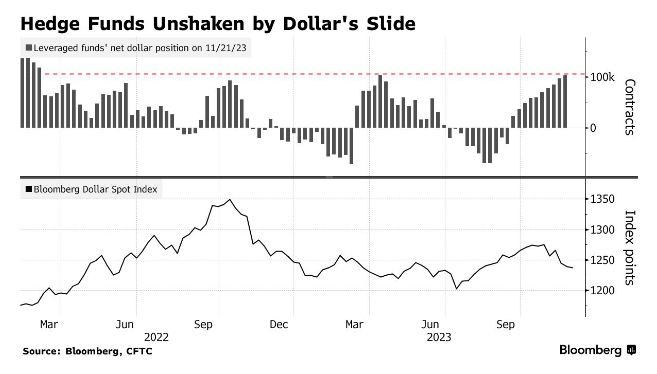
Hedge Funds now have the largest long position in the US dollar since February 2022
Source: Barchart, Bloomberg
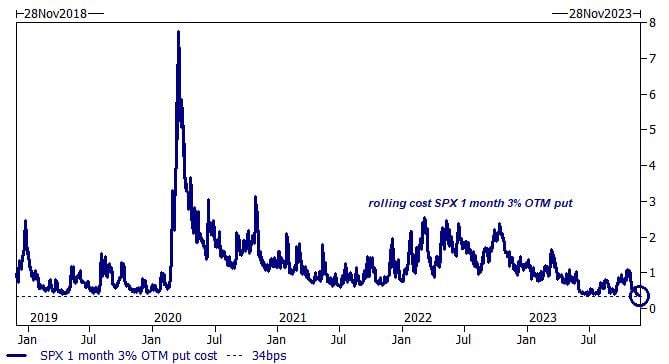
Goldman: Hedging against a market crash is the cheapest in more than five years...
The chart below shows the cost of a rolling SPX 1 month 3% OTM put: the current cost is 34 basis points, the lowest level in 5 years. Source: Goldman Sachs, TME
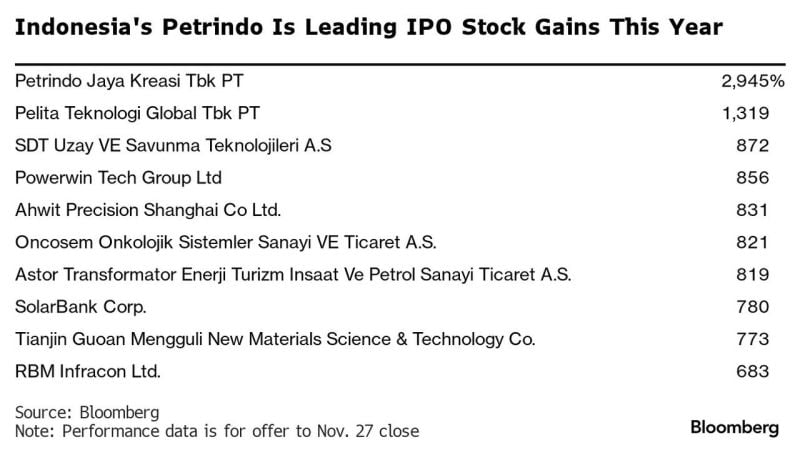
Here's the list of the best performing IPO in the world so far in 2023 YTD
The world’s best-performing IPO stock this year is a little known Indonesian coal mining company that’s backed by one of Southeast Asia’s richest men. PT Petrindo Jaya Kreasi has soared more than 2,900% since it listed in March following a $25 million offering. Yet it still has no analyst coverage, is richly valued and has relatively low trading volumes. Counting Indonesian billionaire Prajogo Pangestu as its main shareholder, the company’s market value has grown by more than 25 times to $5.4 billion in just nine months. Indonesia has been one of the most vibrant markets for initial public offerings globally this year, partially helped by a boom in demand for renewable energy stocks. Petrindo, in particular, is among a cohort of Indonesian stocks that have posted unexplained gains and wild swings this year, reaping fortunes for their backers and leading to regulatory scrutiny. Source: Bloomberg, www.zerohedge.com
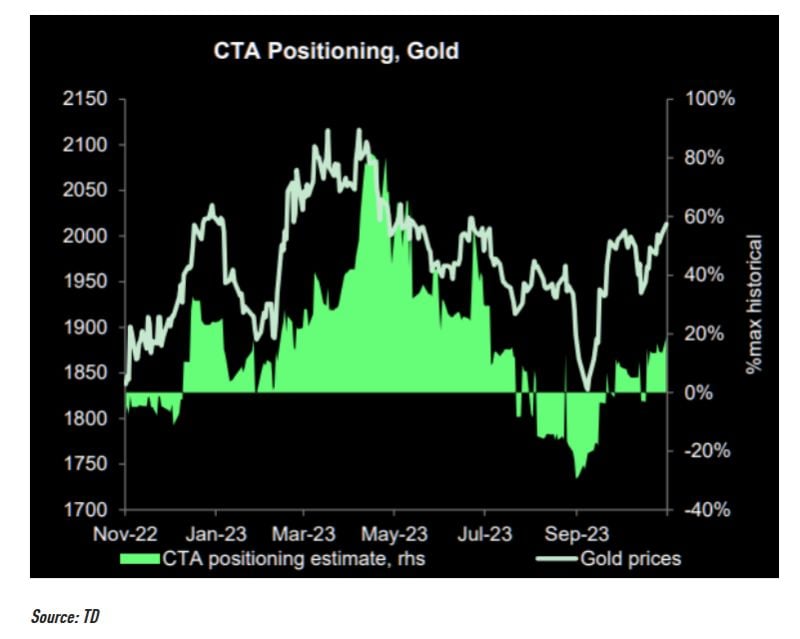
They just started buying gold...
CTAs have reversed the gold short into a long, but they could be buying much more on the back of this break out. They are more than happy to play this momentum move... Source: Bloomberg, TME
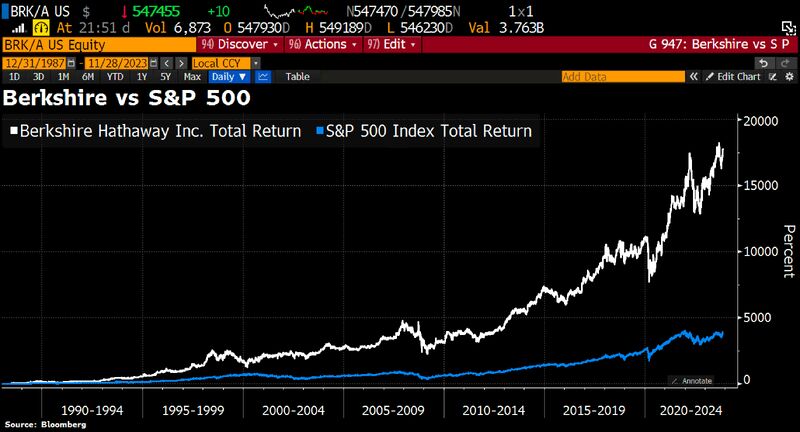
Charlie Munger, Warren Buffett's Partner and 'Abominable No-Man,' dies at 99
Munger helped Buffett, who was seven years his junior, craft a philosophy of investing in companies for the long term. Under their management, Berkshire avg an annual gain of 20.1% from 1965 through 2021 — almost twice the pace of the S&P 500 Index. Source: Bloomberg, HolgerZ
Per Bloomberg, US Treasury issuance next year is expected to reach $1.9 trillion...
Excess supply of US Treasuries remains a key downside risk for bonds (and thus for equities given the still high correlation between the 2). Note that every Treasury auction is now very closely monitored by investors with some immediate consequences on market returns (e.g last week: strong auction triggered a drop in US Treasury yields on Wednesday and a rise in sp500). Source picture: Markets Mayhem
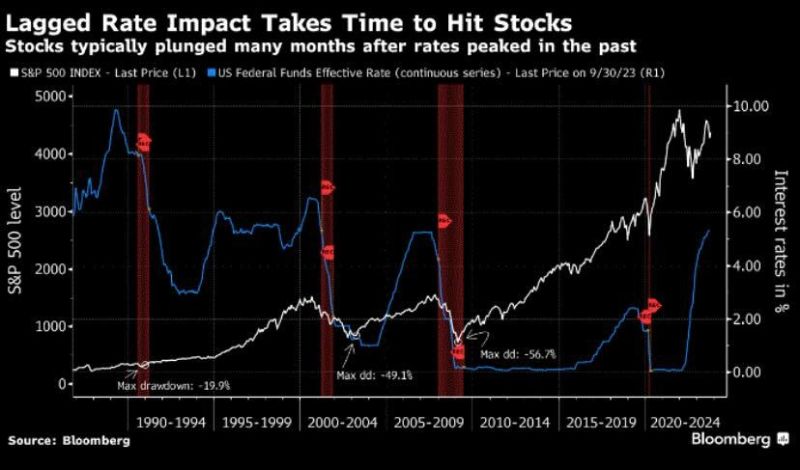
As we moved into 2024, one downside risk needs to be kept in mind:
tightening monetarypolicy cycle often operates with a lag. As shown on the chart below, stocks typically plunged many months after rates peaked in the past. Source. Bloomberg, Cheddar Flow