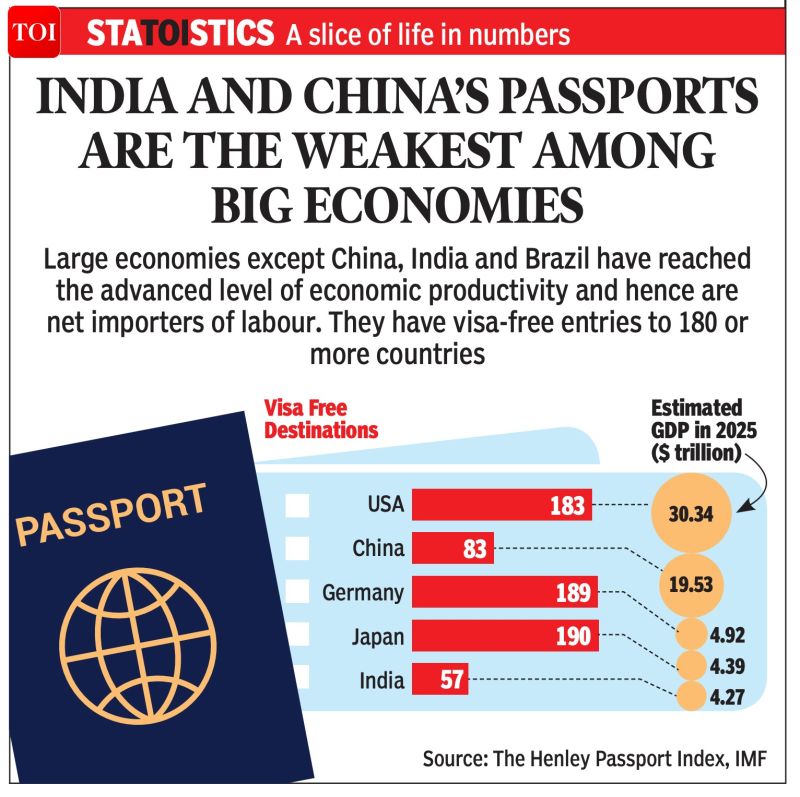
STATOISTICS | India and China's passports are the weakest among big economies
Large economies except China, India and Brazil have reached the advanced level of economic productivity and hence are net importers of labour. Source: The Times Of India @timesofindia
A major theme for the years to come...
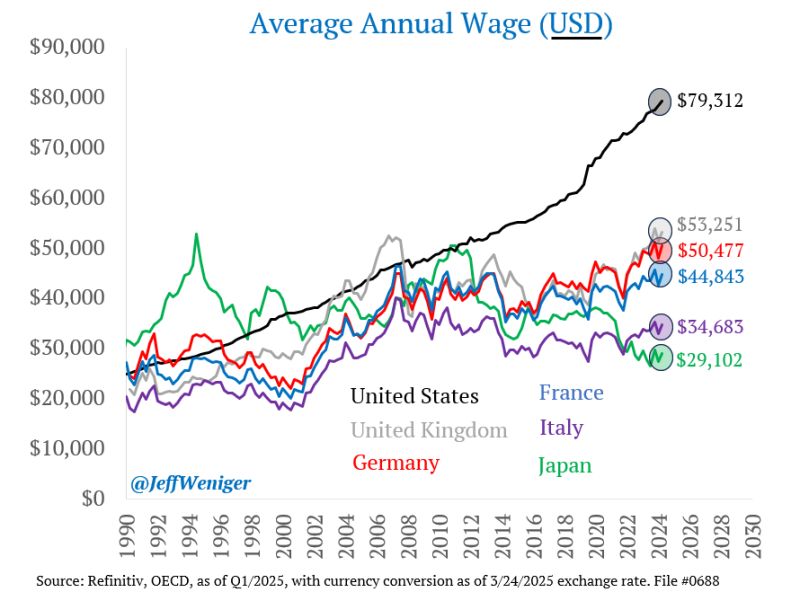
A massive wage arbitrage has opened between the US and its competitors. The overwhelming majority of people in the US have no idea just how much more money they make than the Japanese, French, British, etc. Source: Jeff Weniger
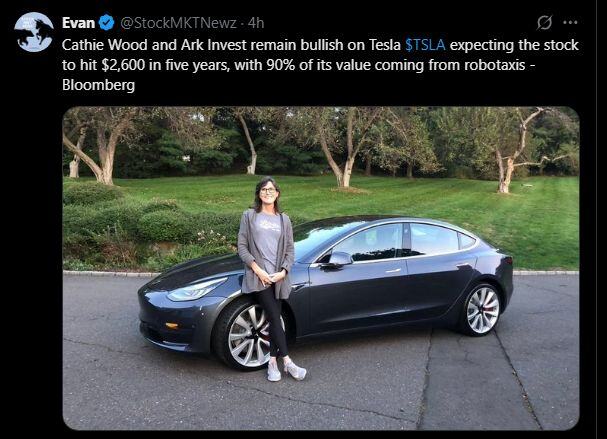
Cathie Wood and Ark Invest remain bullish on Tesla $TSLA expecting the stock to hit $2,600 in five years, with 90% of its value coming from robotaxis
- Bloomberg
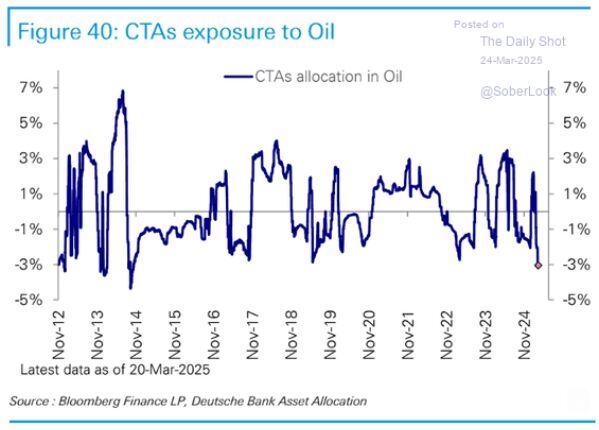
CTAs have now built the largest short position in Oil since 2014
Source: Barchart, The Daily Shot
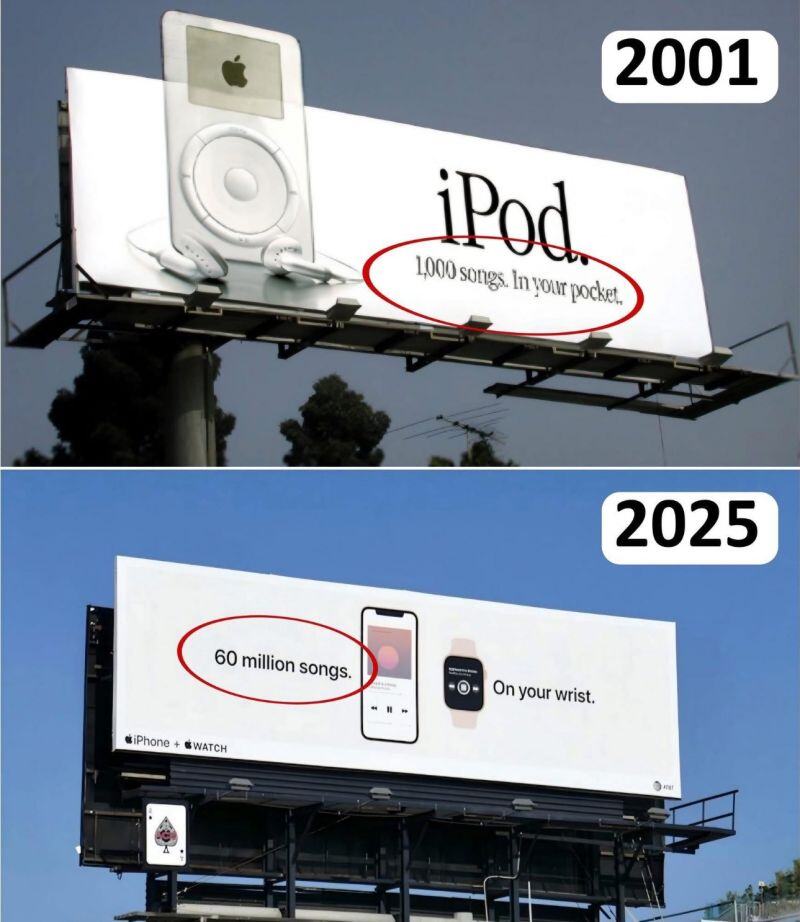
We have come along way...
Source: Out of Context Human Race @NoContextHumans
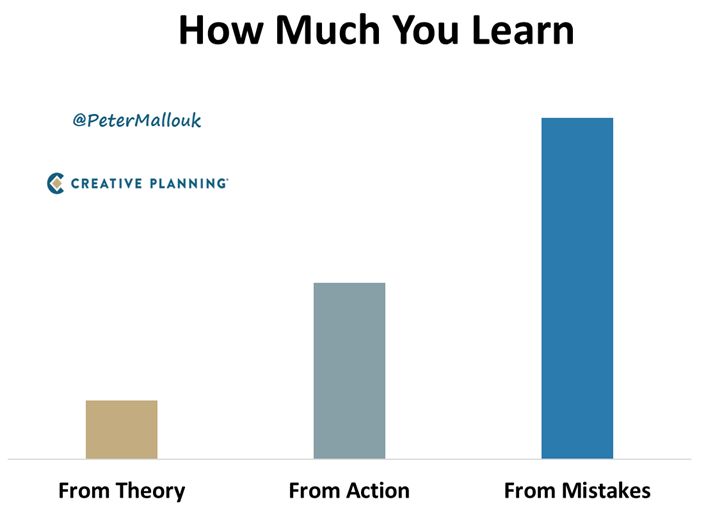
“The only real mistake is the one from which we learn nothing.” – Henry Ford
Source: Charlie Bilello @PeterMallouk
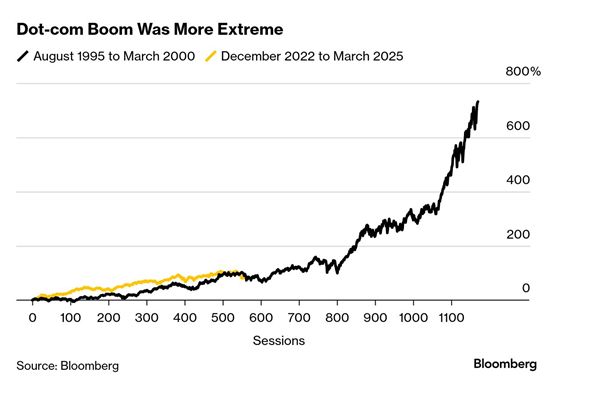
🎈 Happy Anniversary, Dot-Com Bubble.
On this day 25 years ago — March 24, 2000 — the S&P 500 hit a peak it wouldn’t revisit until 2007. Three days later, the Nasdaq 100 reached its final all-time high… for the next 15 years.
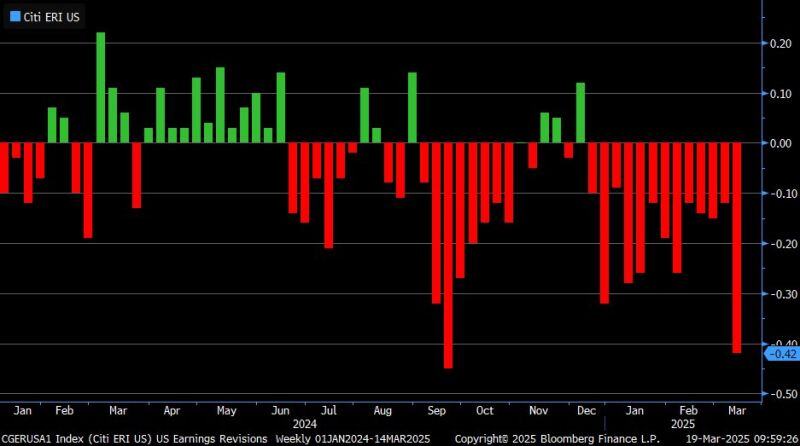
U.S. Earnings Revisions Index from @Citi has been negative for 13 consecutive weeks.
Source: Liz Ann Sonders, Bloomberg