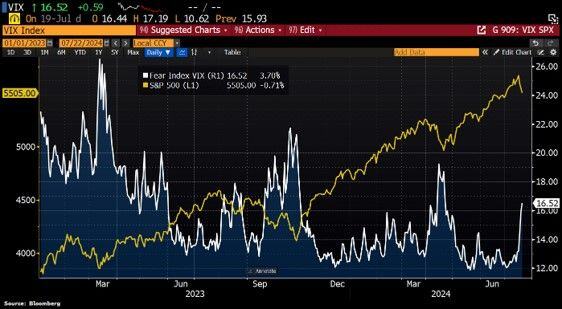
The end of complacency? Fear Index Vix has jumped 32.6% last week, the biggest weekly increase since March 2023.
But at 16.5, the Vix level is still below the long-term average of 19.8. And remember that during election years, volatility tends to increase by 25% between July and November... Source: HolgerZ, Bloomberg
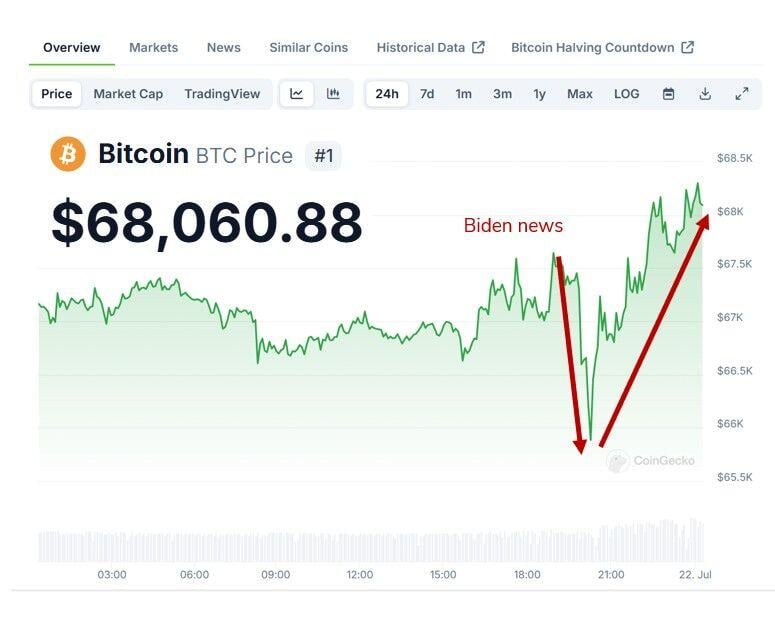
Bitcoin $BTC reaction following the news that Biden is leaving the race was heavily scrutinized by market participants for 2 reasons
1/ It is the only risk assets traded 24/7 and thus reacting to news over the week-end; 2/ Bitcoin is now seen as a "pro-Trump" asset (i.e of it goes down that means that markets see a lower chance for Trump to be re-elected). While the initial reaction to the news was BTC going down almost $1,000 in a matter of minutes, BTC bounced back later on to trade at the highest level of the week-end (around $68k). So if Bitcoin is any guide, the Trump election trade does not seem to have been damaged... Source chart: coingecko
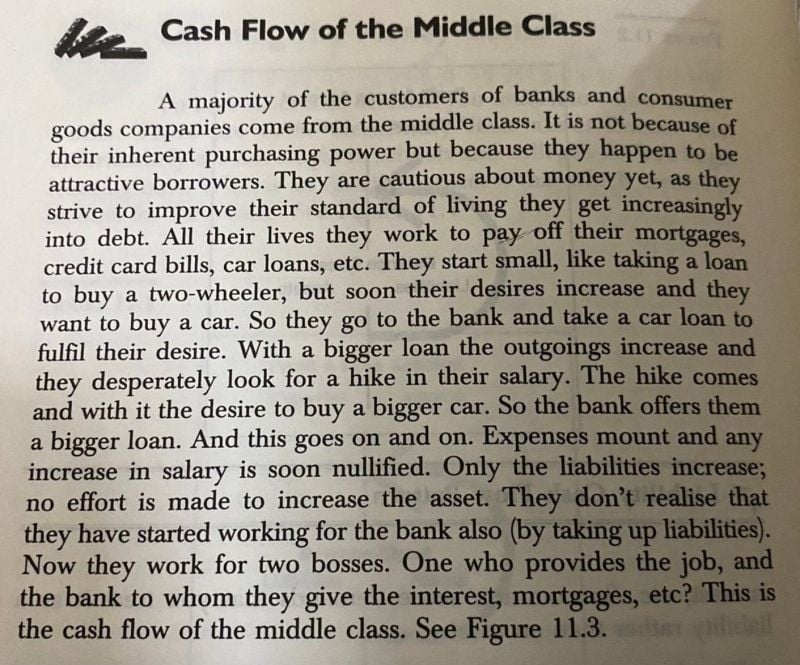
Rich Dad's guide to Financial freedom - Robert Kiyosaki
Extract of the "Cash Flow of the Middle Class" Source: InvestmentBooks Dhaval
This is not the first correction $SMH semiconductors ETF is going through
Source: Trend Spider

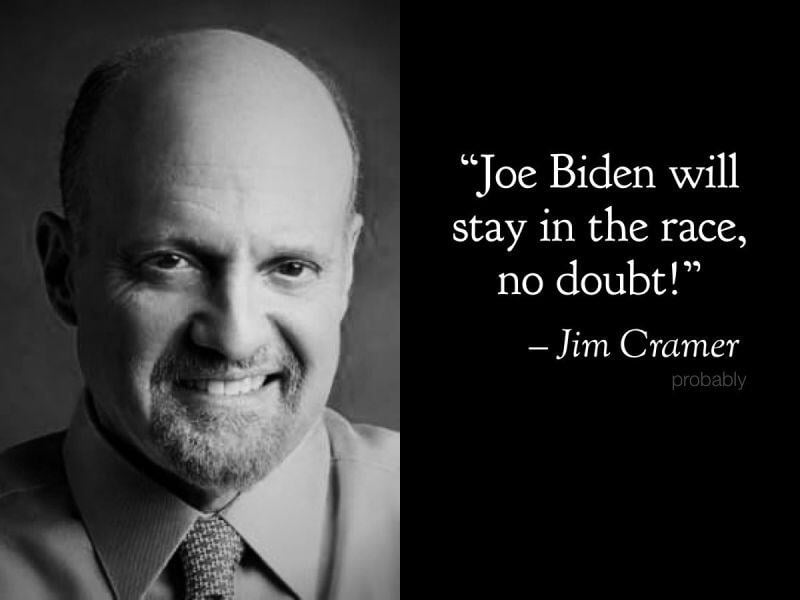
It was inevitable...
Source: Inverse Creamer (Not Jim Cramer) on X
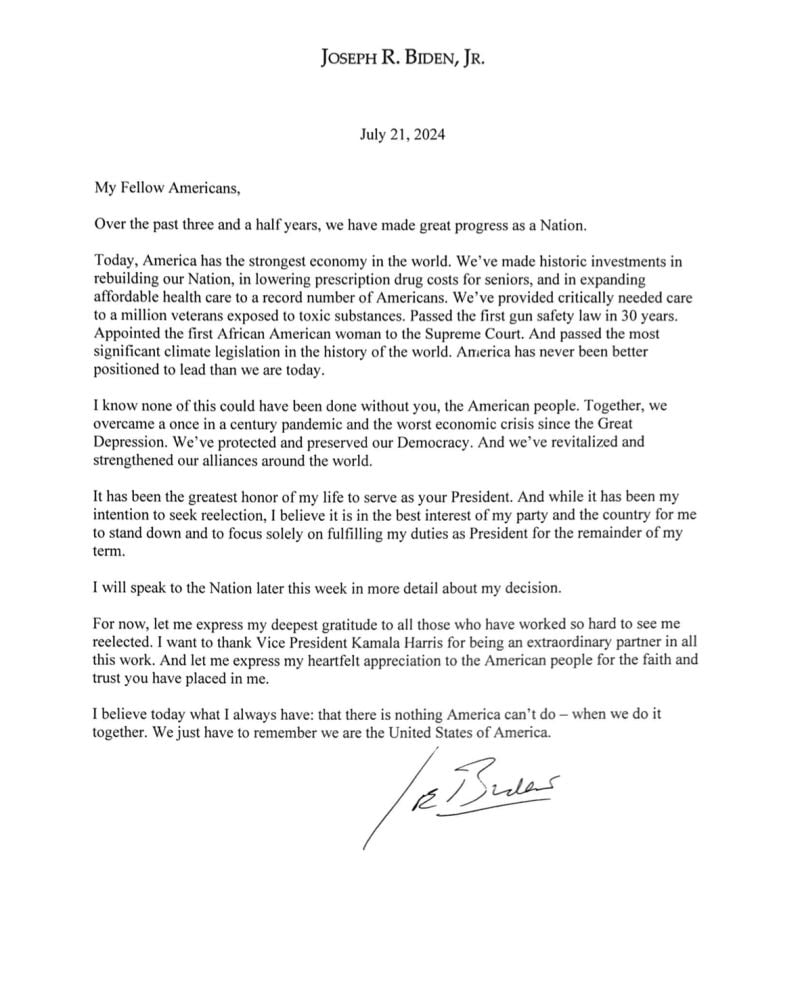
President Biden announces he is dropping his re-election bid and endorses Vice President Kamala Harris as the Democratic candidate.
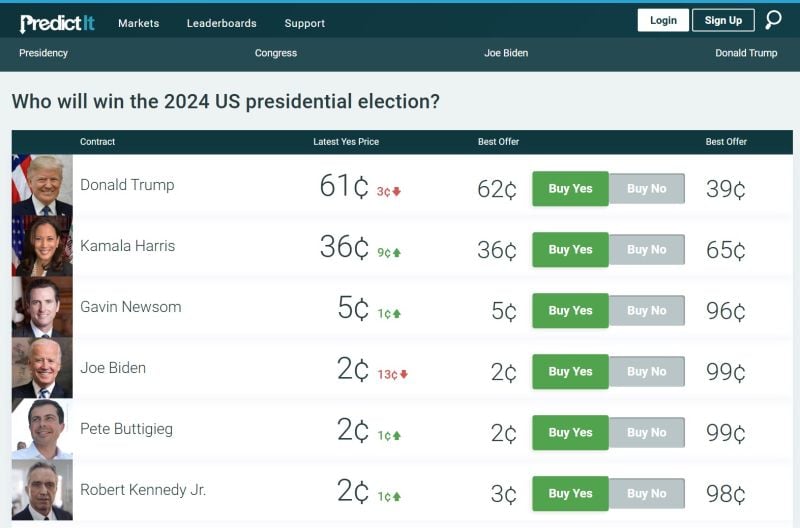
Here is where we stand on Predictit.
BREAKING >>> BIDEN IS DROPPING OUT OF PRESIDENTIAL RACE
US President Joe Biden has abandoned his re-election bid following overwhelming pressure from fellow Democrats, saying that “it was in the best interest of my party and the country for me to stand down”. The president announced his decision in a letter published to social media on Sunday, throwing this year’s White House race into turmoil with less than four months to go until voters in the world’s biggest economy elect their new leader on November 5. Biden’s announcement follows more than three weeks of wrenching debate among Democrats about his candidacy after a disastrous debate performance against Trump reignited concerns about his mental acuity and damaged his standing among American voters. An Associated Press poll out last week found nearly two-thirds of Democratic voters said Biden should drop out of the race. Source: FT
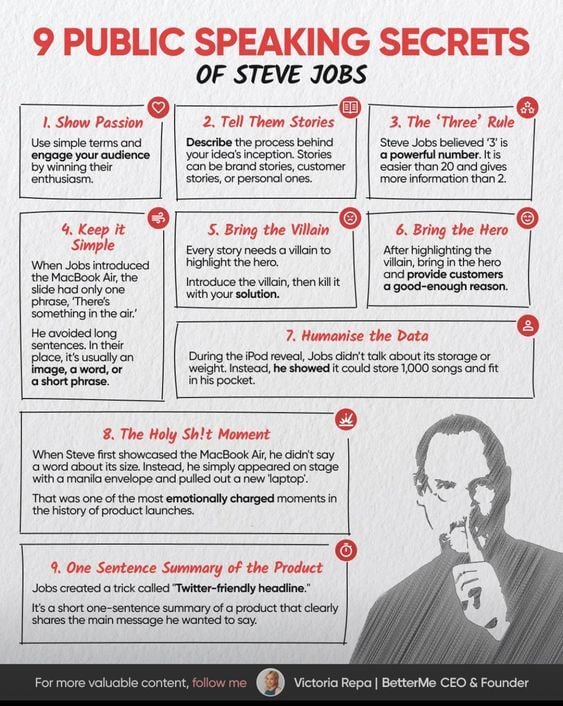
Public speaking secrets of Steve Job
Source: Scholarship for PhD