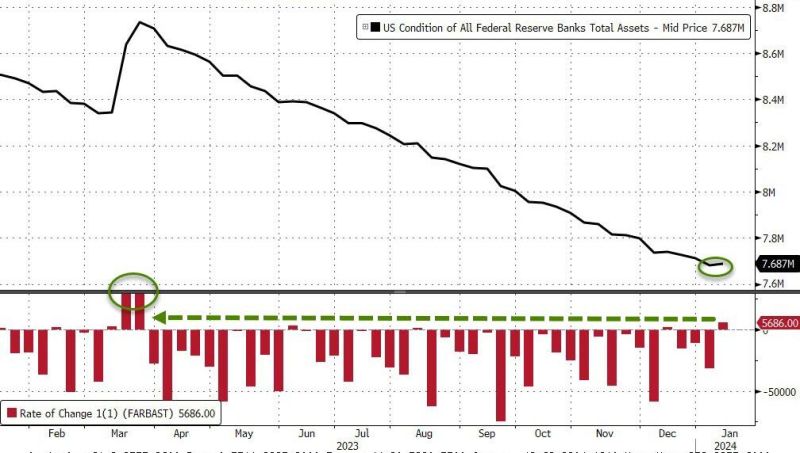
The Fed balance sheet expanded last week by $5.7BN - the most since March's SVB crisis...
Source: Bloomberg, www.zerohedge.com
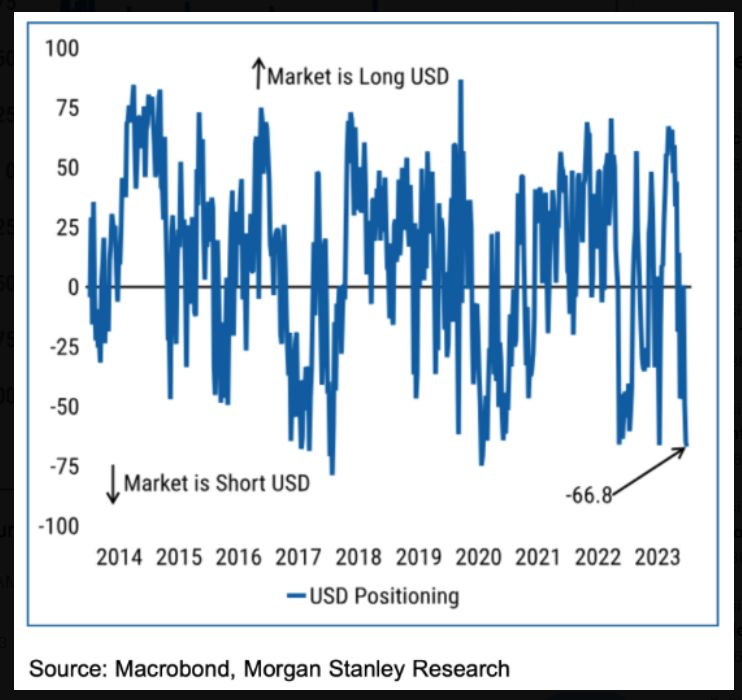
Speculators have built their largest short U.S. Dollar position since 2020 and one of the largest in history
Source: barchart
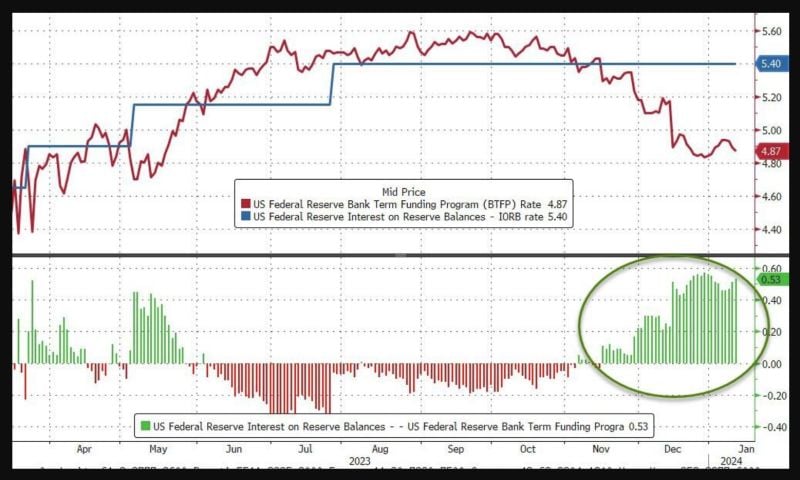
Wondering by us bank stocks are doing well?
Since the introduction of the Bank Term Funding Program (BTFP) in March, there is a nice arbitrage opportunity for banks - watch out on the chart below the gap between the rate on the Federal Reserve’s nascent funding facility and what the central bank pays institutions parking reserves. Since March / SVB crisis, the BTFP-Fed Arb continues to offer 'free-money' to banks - and usage of the BTFP has risen by $38BN since the arb started to exist. Source: Bloomberg. www.zerohedge.com
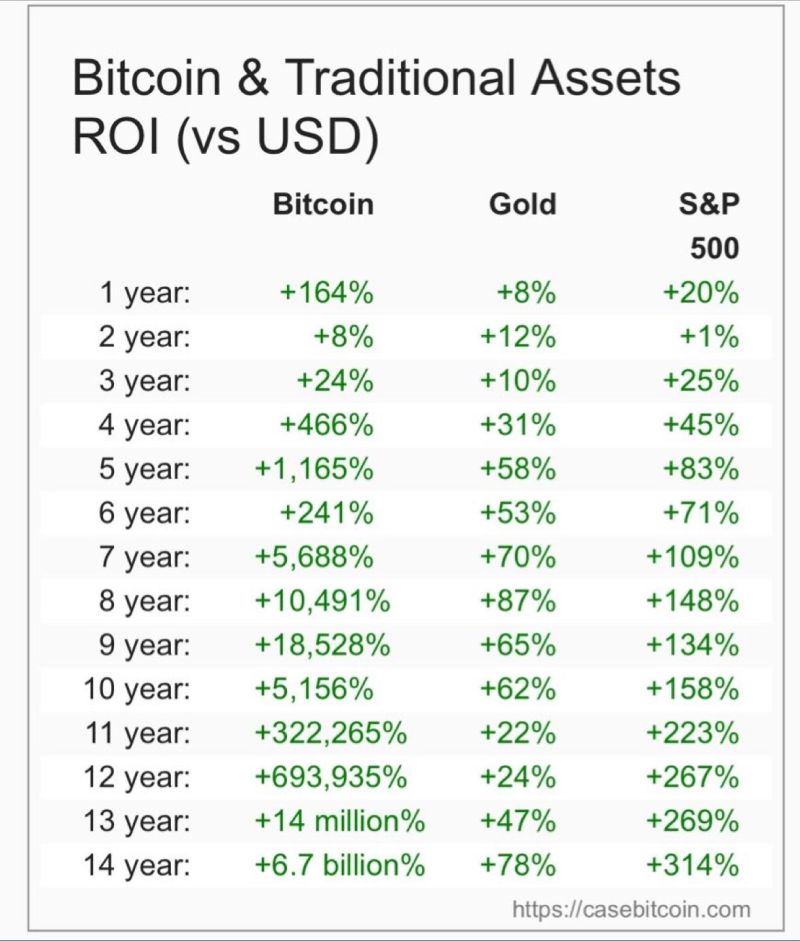
HOLDRs have been nicely rewarded over the last few years
Source Table: Dan Held
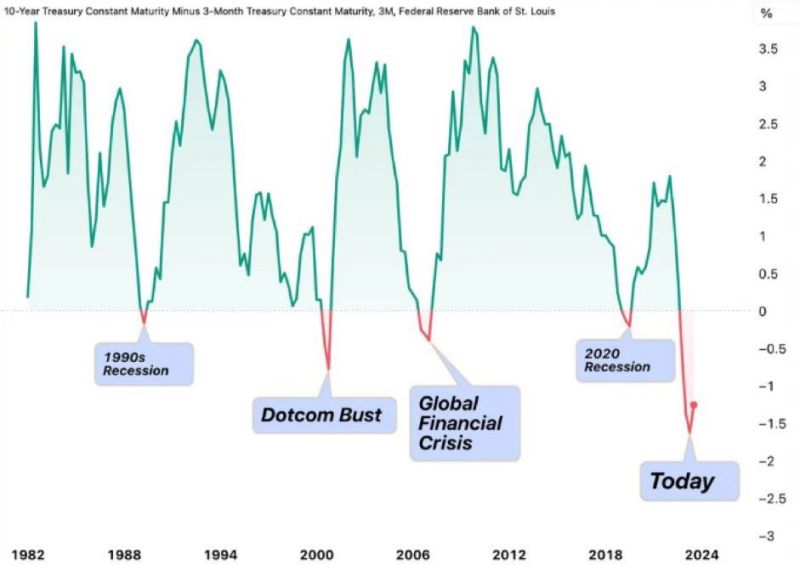
The last 4 times the 10Y Minus 3M Treasury Yield Curve inverted, it led to the 1990s recession, the Dotcom Bust, the Global Financial Crisis, and the 2020 Recession.
Will this time be different? 🤔 Source: Barchart
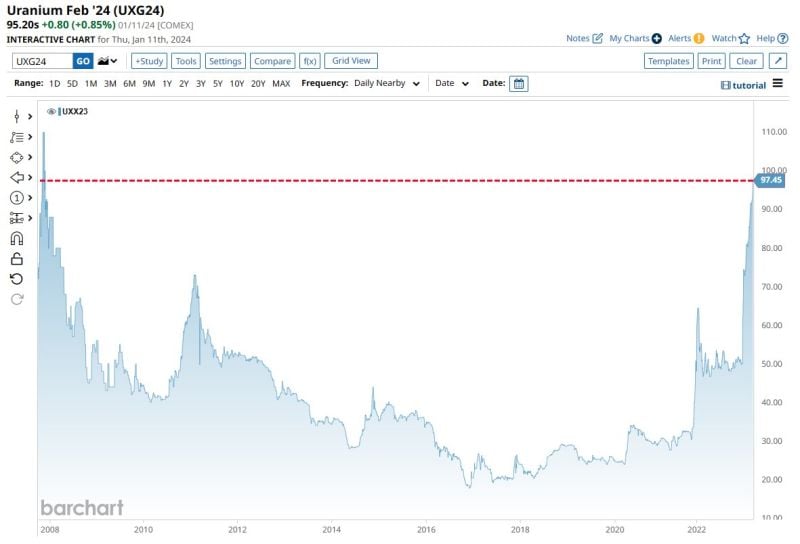
Uranium 16-Year High: Uranium going parabolic as it hits its highest price since November 2007
Source: barchart
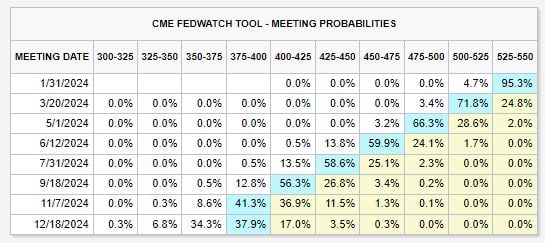
Surprise, surprise... Even with a hot jobs report and inflation rising to 3.4%, market expectations regarding timing and number of rate cuts have shifted more dovish.
Markets are now pricing-in a rate cut at EVERY Fed meeting this year beginning in March 2024 until December 2024. Effectively, markets are saying that us interestrates will move in a straight-line lower. Source: The Kobeissi Letter
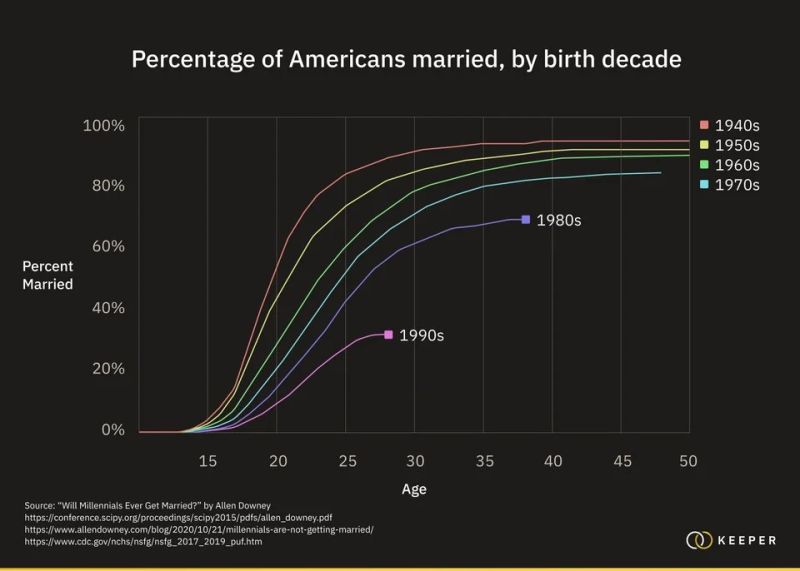
Less and less Americans are getting married.
This is negatively impacting family formation and leading to a slower population growth rate as a result. Source: Markets & Mayhem, Bloomberg