4 Jan 2024
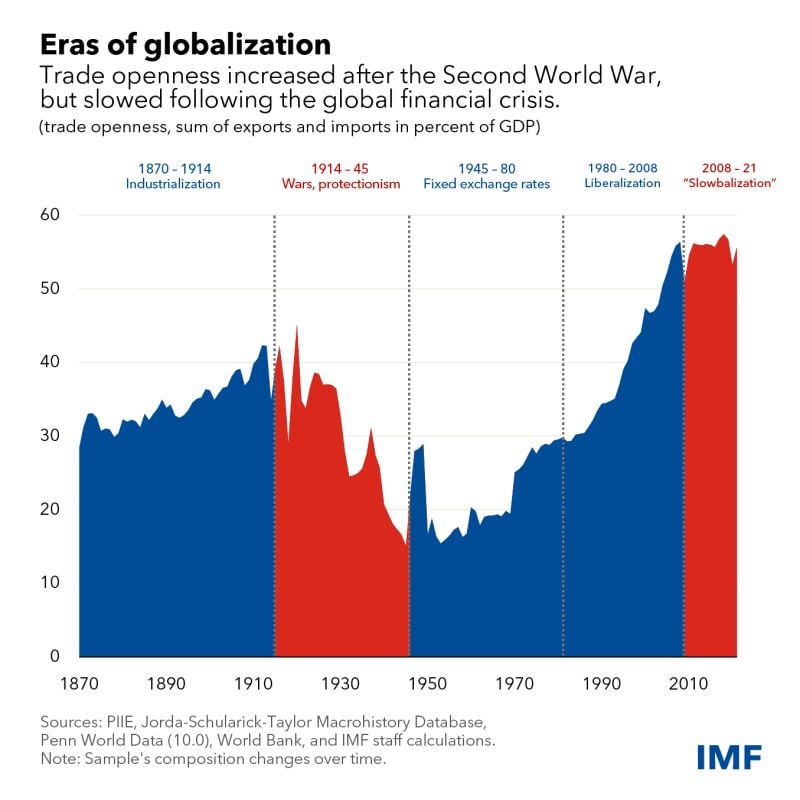
Net effect of slowbalization is growing stagflation risk
Update "slowbalization" chart by IMF.
4 Jan 2024
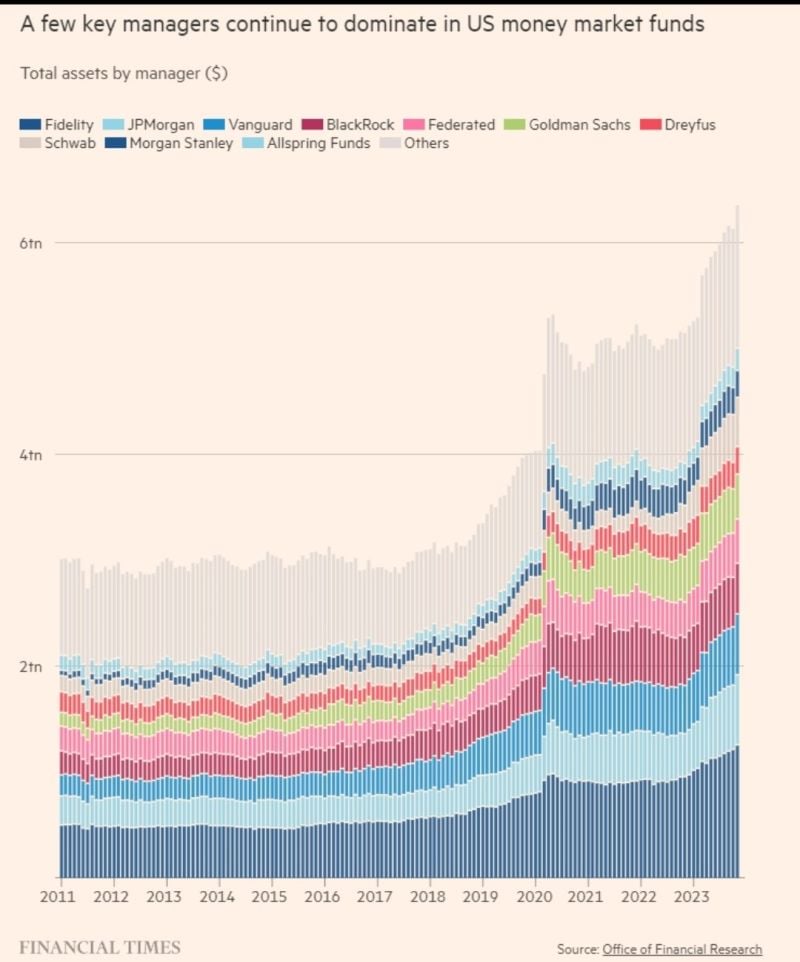
All-Time High $6.3 Trillion sitting in U.S. Money Market Funds
Source: Win Smart, CFA, FT
4 Jan 2024
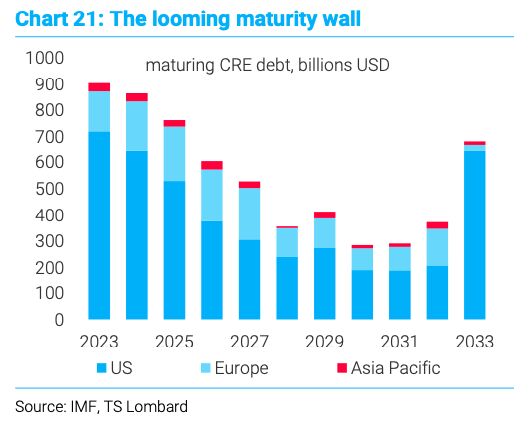
Billions of commercial real estate debt mature this year
Unlike US home loans, CRE debt is almost entirely interest-only. Borrowers tend to have low monthly payments but face a balloon payment equal to original loan on maturity. Source: Dabiel Baeza, TS Lombard
4 Jan 2024
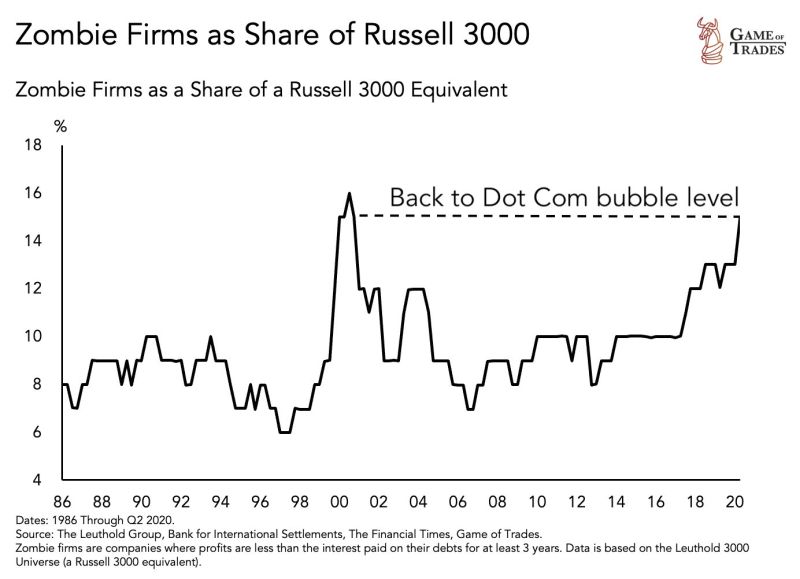
Zombie firms as a % of Russell 3000 is now back to Dot Com bubble levels
Source: Game of Trades
4 Jan 2024
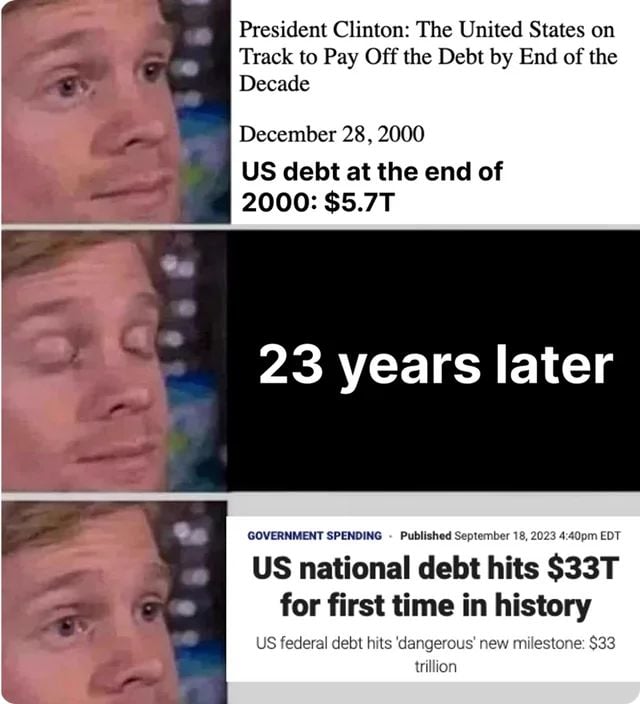
If you blinked you would have missed that one time that the US government was on track to pay down its debt...
Source: Markets & Mayhem
4 Jan 2024
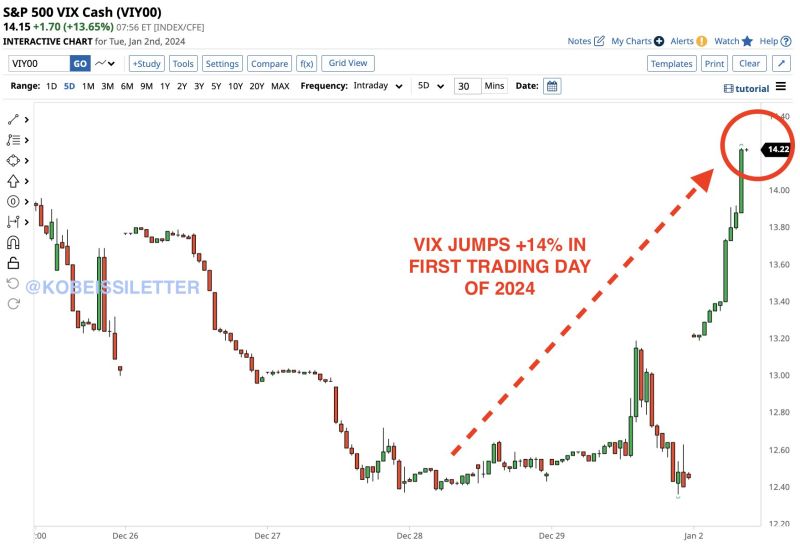
The volatility index, $VIX, is up 14% to kick off the first trading day of 2024. This puts the $VIX on track for its biggest daily jump since October 13th
Source: The Kobeissi Letter
4 Jan 2024
Charlie's rules to lead a successful life
by Compounding Quality

4 Jan 2024
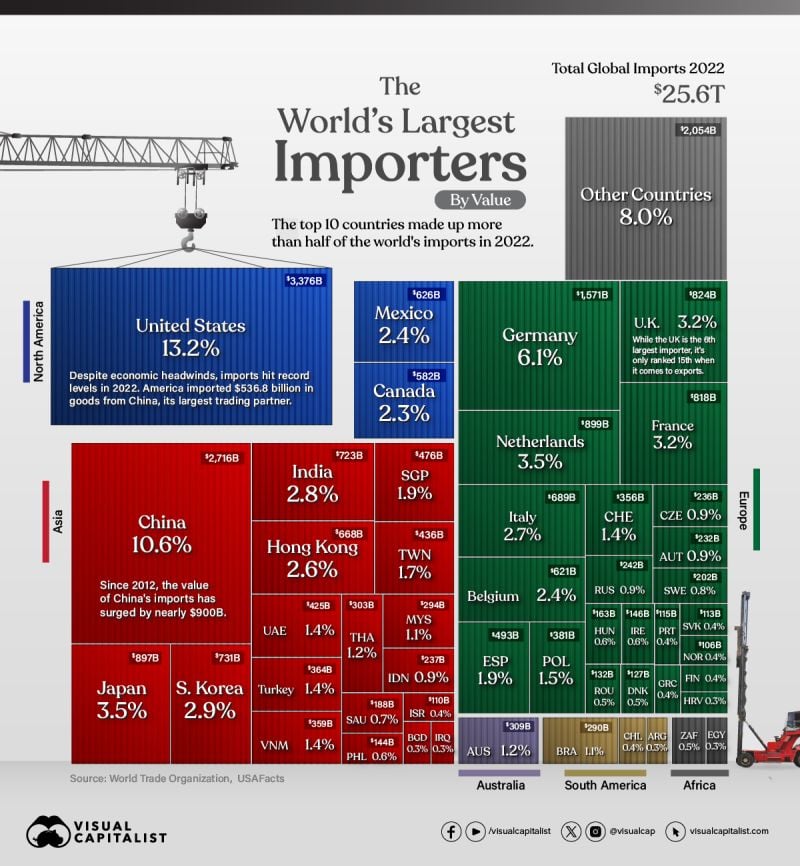
The Top 50 Largest Importers in the World by Visual Capitalist In 2022, global imports climbed to $25.6 trillion in value, or about the size of the U.S. GDP
As an engine of growth, global trade broadens consumer choices and can lower the cost of goods. For businesses, it can improve the quality of inputs and strengthen competitiveness. This graphic shows the 50 largest importers, with data from the World Trade Organization.