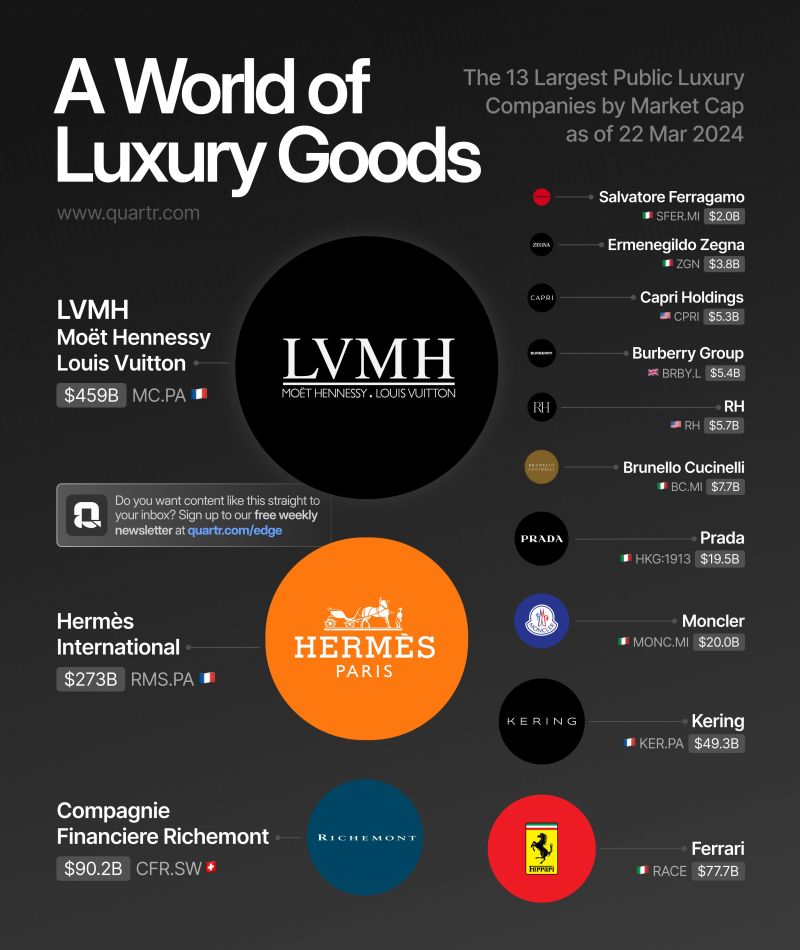
Quartr just created this infographic that illustrates the 13 largest luxury companies worldwide by market cap.
Four intriguing facts: → $LVMH's market cap is almost 60% larger than the combined market caps of the bottom 10 companies on the list. → $RMS is by far the largest single-brand company on the list and ~3.5x larger than $RACE. → Despite owning 10+ brands including iconic maisons such as Gucci, Saint Laurent, and Bottega Veneta, $KER's revenue is "only" ~€20B, compared to Hermès' €13B. → Tiffany & Co. was acquired by LVMH during the pandemic at a valuation of $16 billion, which would place them at #8 on this list.
In professional communication, your writing often serves as the first impression for those who don't know you personally
So conveying confidence and maintaining respect is essential. Source: agrossoblog.org

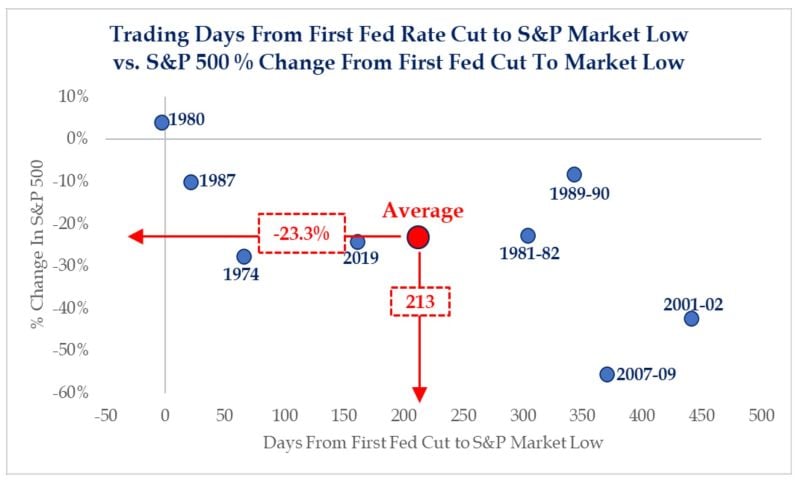
Don't be too excited about Fed rate cuts.
Examining Fed rate cycles since 1970s has revealed that investors have more to fear from 1st cut in a cycle than the pause. On average, sp500 is up +5% over 100 days between last Fed tightening and 1st cut. The trough in broader market is -23% over 200 days after 1st cut in a series, SRP has calculated. Source: HolgerZ
Great visual by Quartr ->
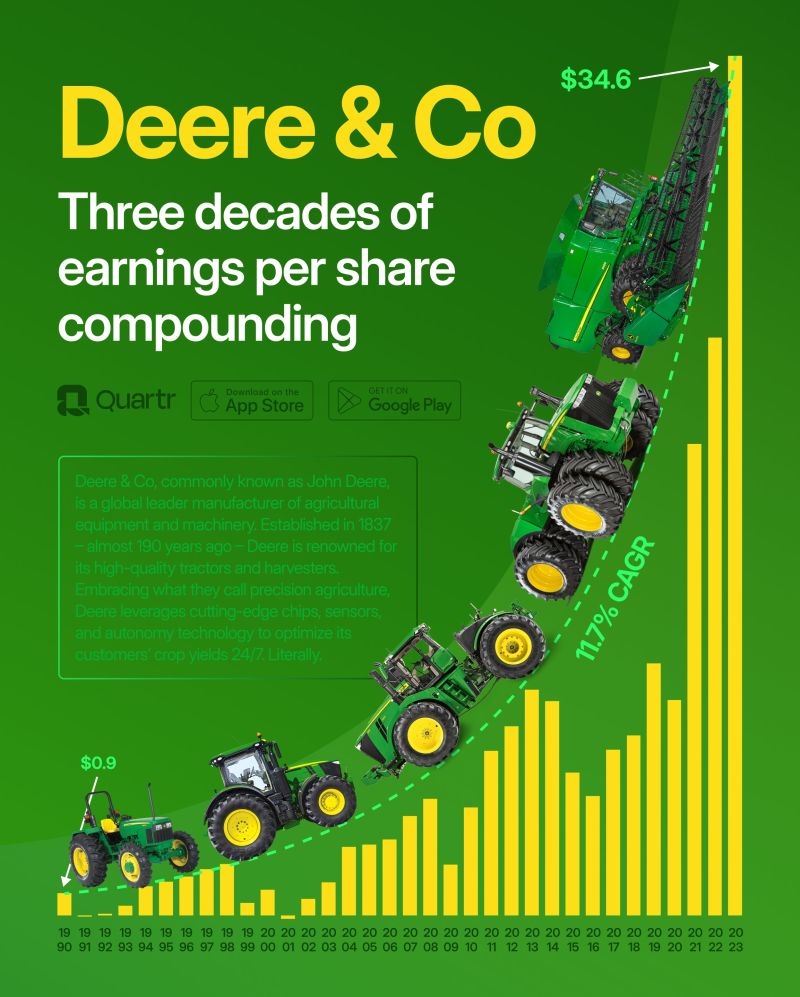
Agriculture equipment giant $DE may appear boring at first glance. Under the hood lies a complex and fascinating entity with a rich 187-year history, leveraging cutting-edge chips, sensors, and autonomy technology. $DE has grown its EPS at a 11.7% CAGR, or 38x, since 1990
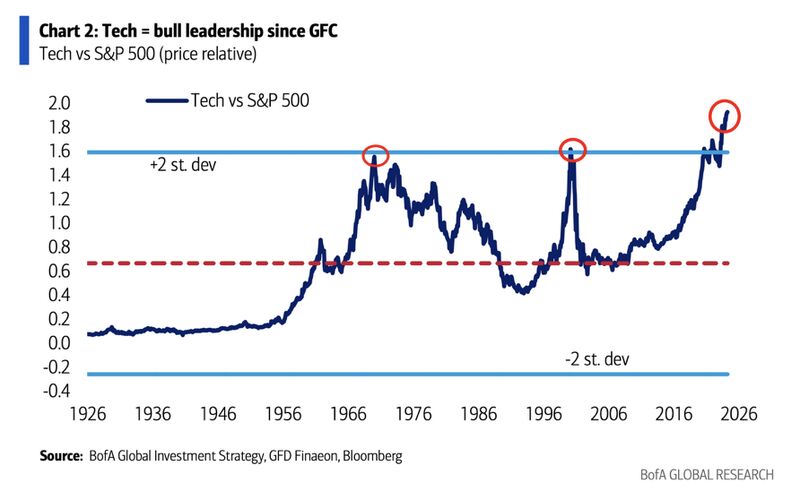
Tech Stocks are trading at all-time highs relative to the SP500, even surpassing the peak of the Dot Com bubble...
Source: BofA, Bar chart
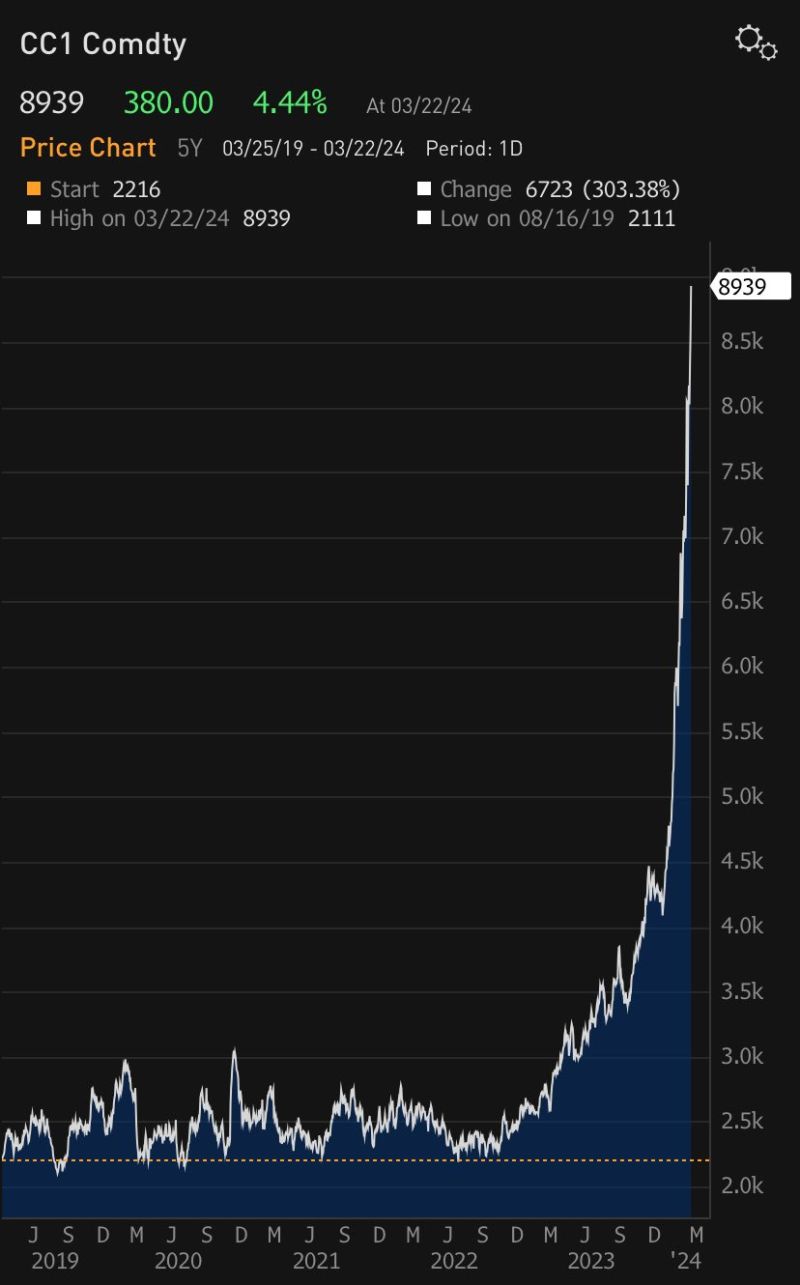
Cocoa is the new crypto
Source: David Ingles, Bloomberg
In case you missed it:
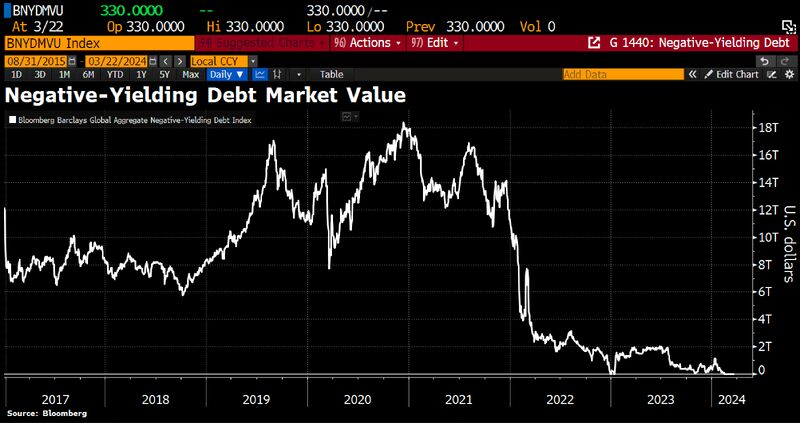
After bank of japan abolished negative interest rates this week for 1st time since 2016, the volume of bonds with negative interest rates has shrunk to $300mln. At its peak, there was a volume of $18tn worth of bonds with negative rates. But this weird experiment seems to be over – for now. Source: HolgerZ, Bloomberg
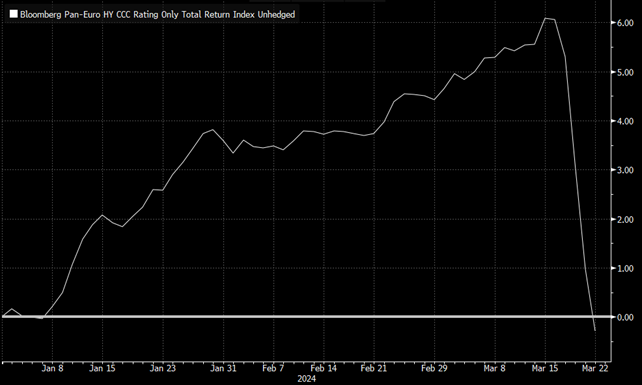
#ChartOfTheDay: European High Yield Faces CCC-Rated Headwinds 📊
European High Yield markets encountered headwinds last week, particularly among the weakest issuers with CCC ratings, which experienced a notable decline of -0.7%. This downturn was fueled by renewed credit concerns, exemplified by significant drops (-30 points) in the senior unsecured debt of Altice France following debt restructuring announcements, and Ardagh Packaging exploring its debt structure. These incidents follow the recent Intrum crisis, where debt collector bonds plummeted by 20 points amid restructuring talks. These developments have erased the year-to-date gains of CCC-rated bonds in Europe, which stood at +6% before last week's events. This serves as a stark reminder of how quickly circumstances can change, especially in today's volatile interest rate environment! Stay informed and vigilant in navigating the ever-changing landscape of high yield markets. #HighYield #CreditConcerns #MarketVolatility 📉