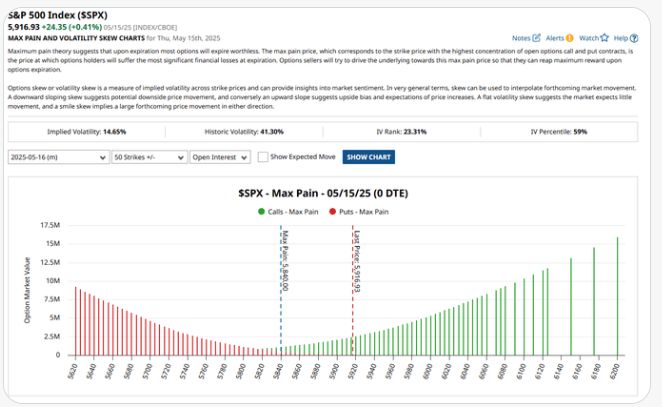
$1.2 Trillion of S&P 500 $SPX notional options exposure is set to expire on Friday with a max pain price currently sitting at 5,840
Source: Barchart
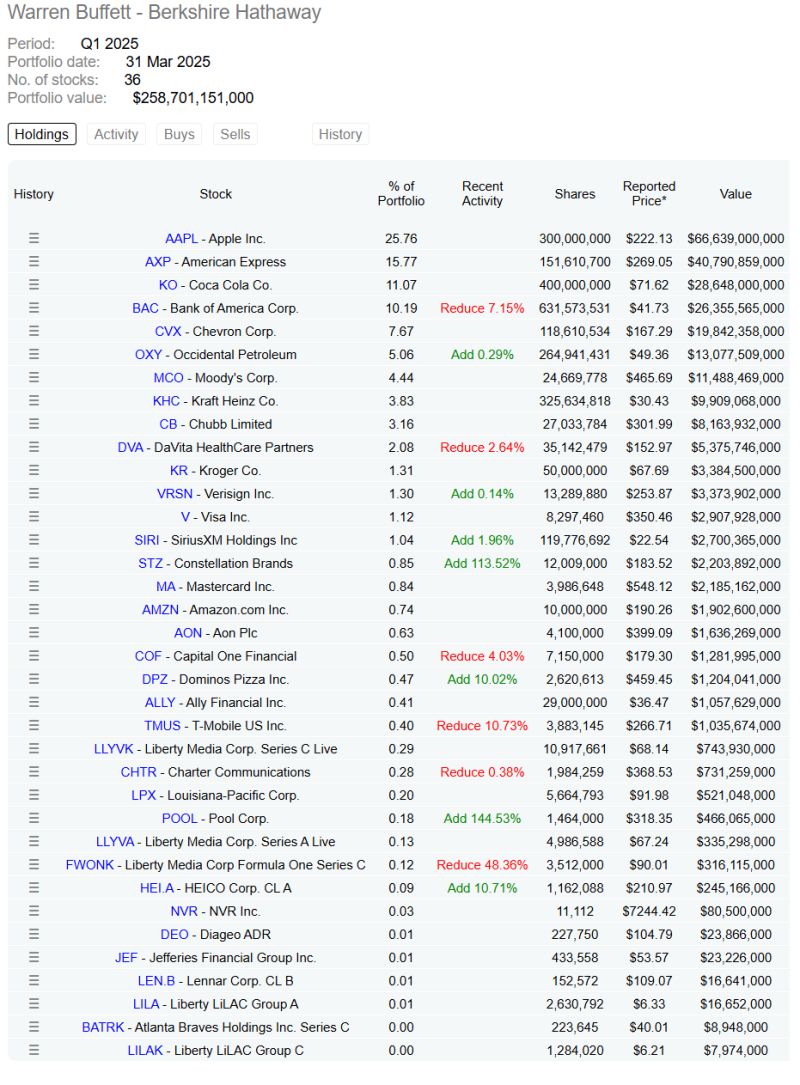
WARREN BUFFETT'S BERKSHIRE HATHAWAY JUST FILED A 13F UPDATING HIS PORTFOLIO FOR Q1'25.
Adds: $POOL, $STZ, $DPZ, $OXY, $SIRI, $VRSN Exits: $NU, $C Reductions: $CHTR, $DVA, $COF, $BAC, $TMUS, $FWONK HERE’S A LOOK AT ALL HIS HOLDINGS: Source: Wall St Engine on X
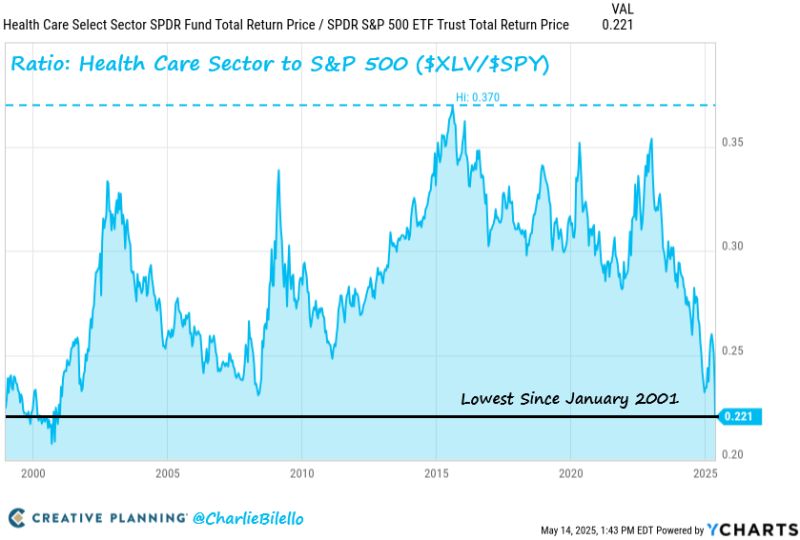
The ratio of the US Health Care sector to the S&P 500 is at its lowest level since January 2001.
The Health Care Sector is down 9% over the past year while the S&P 500 is up 14%. $XLV $SPY Source: Charlie Bilello
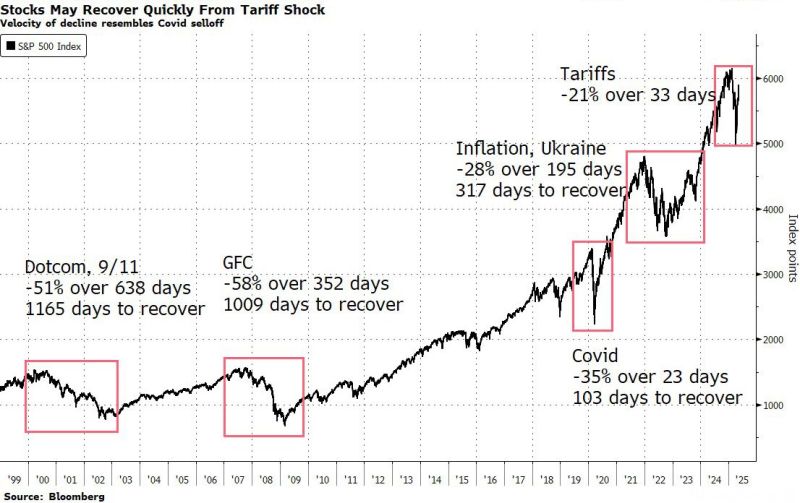
The post-liberation day rebound is almost as fast as the covid bounce.
Only difference is this time the Fed did not inject several trillion Source: zerohedge
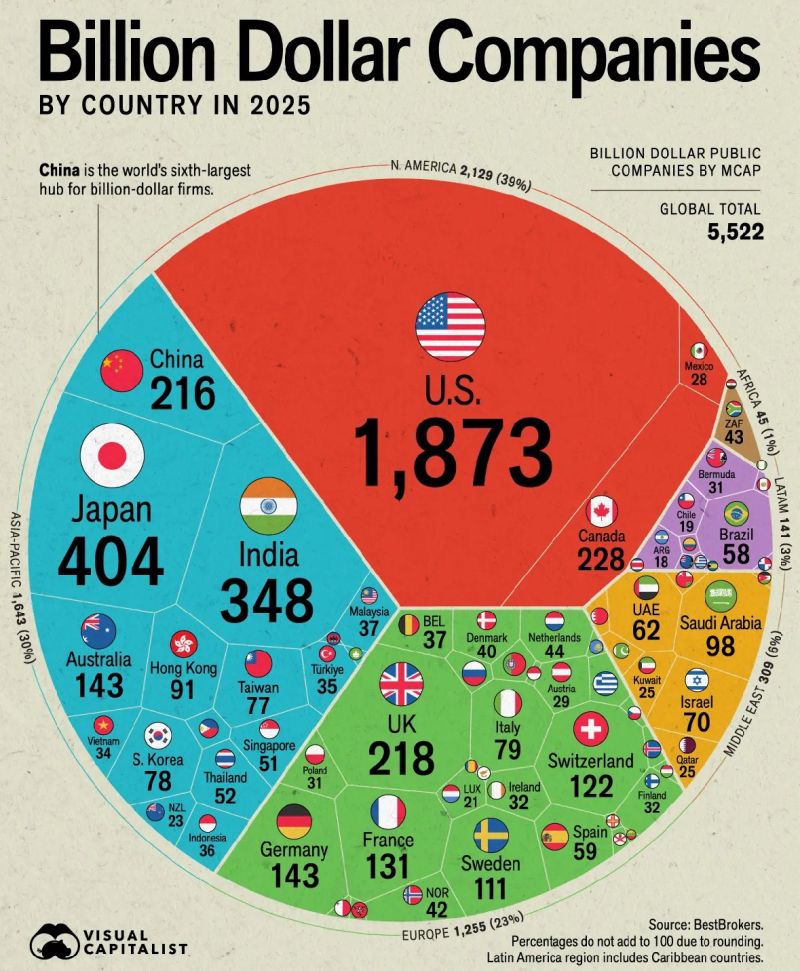
Here’s how many billion dollar companies there are in different countries around the world
Source: Blossom @meetblossomapp
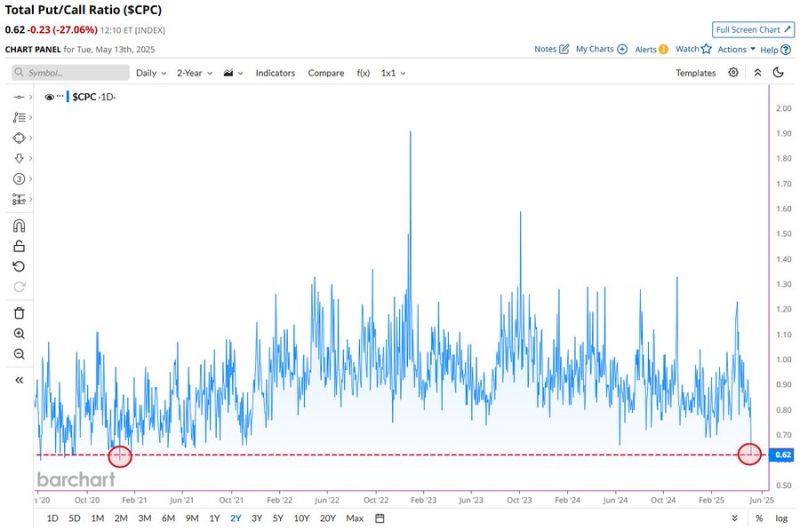
Total Put/Call Ratio is now at 0.62, the lowest level since December 2020
Bulls are out in full force Source: Barchart
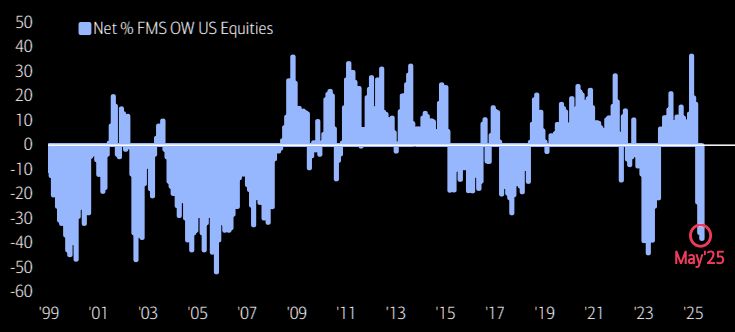
BREAKING 🚨: Fund Managers
Fund Managers have missed out on the recent stock surge after recently reducing their equity exposure to the lowest levels in 2 years 👀 Source: Barchart, BofA
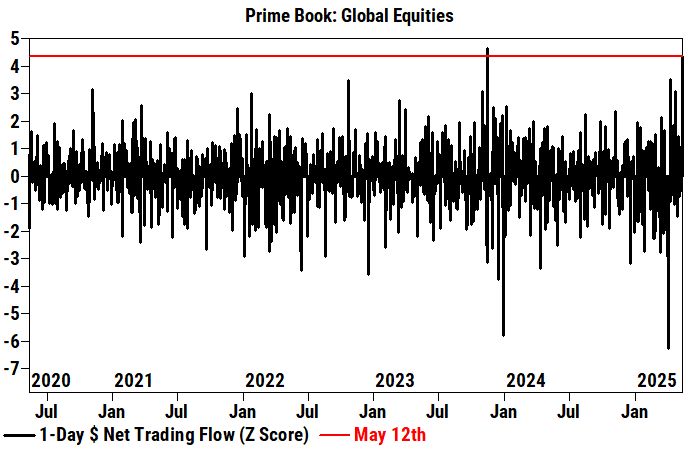
Hedge fund capitulated with second biggest short covering panic on record during Monday melt-up 🚀
On Monday, the Goldman Prime Brokerage Global equities book saw the second largest notional net buying in 5 years (+4.3 sigma), driven by short covers and to a lesser extent long buys (1.6 to 1). All regions were net bought, led by North America and to a lesser extent Europe (both led by short covers). Goldman HF Prime report shows that hedge funds net bought US equities at the fastest pace since Apr 9th (+4.0 sigma one-year), driven by short covers and long buys (1.5 to 1). Single Stocks / Macro Products were both net bought and made up 53% / 47% of the total notional net buying, led by short covers / long buys, respectively. Source: Goldman, zerohedge