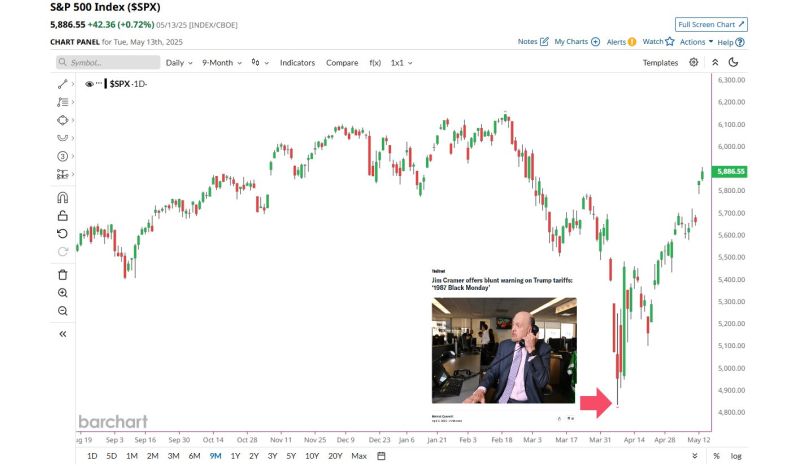
Jim Cramer Remains Undefeated His "Black Monday" warning occurred at the EXACT time that the Stock Market bottomed.
S&P 500 is now in a bull market Source: Barchart
"History does not repeat itself but often rhymes" - Mark Twain
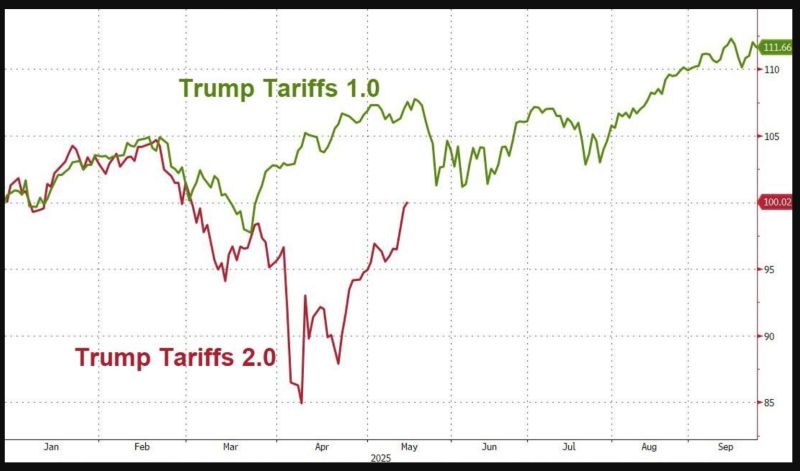
On the back of lower than expected inflation CPI report yesterday, the S&P 500 joined the Nasdaq 100 in the green year-to-date, erasing all of the April pullback. The S&P 500 Trump Tariffs 2.0 line is catching up with the Trump Tariffs 1.0 one... Source: zerohedge
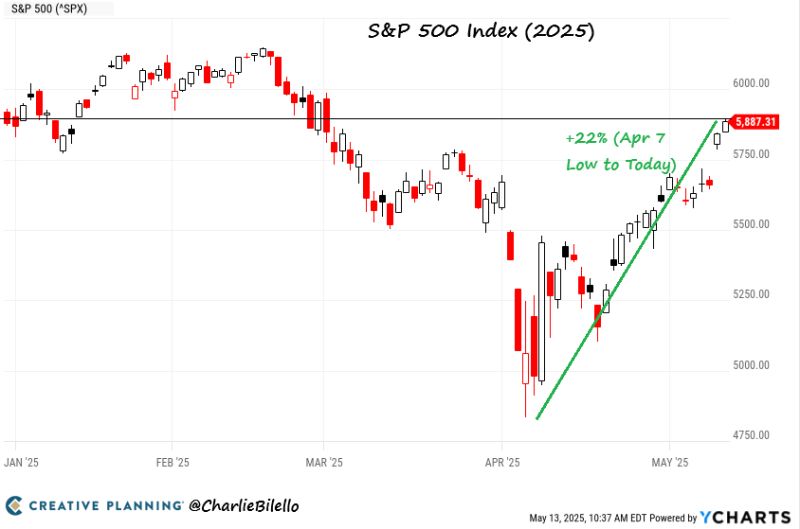
After a 22% rally from the April 7 lows, the S&P 500 is now up on the year.
One of the biggest short-term comebacks in market history. $SPX Source: Charlie Bilello
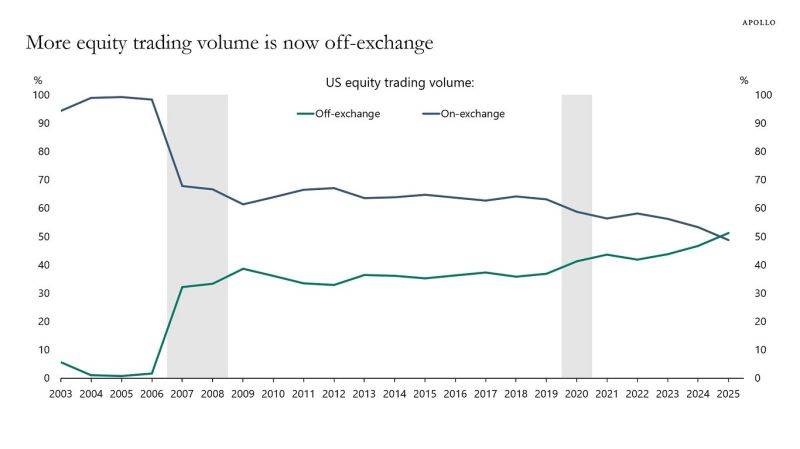
Dark pools are a bigger and bigger part of the stock market, now eclipsing volume at exchanges
Source: Markets & Mayhem, Apollo
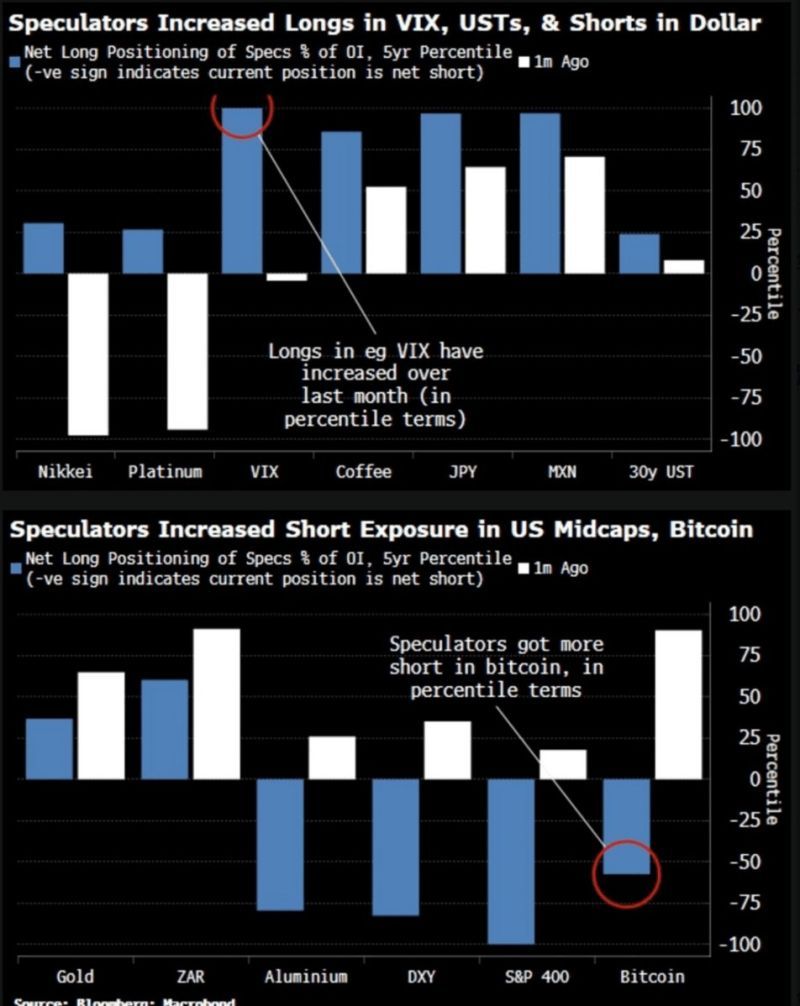
BREAKING: Hedge Funds
Hedge Funds were long volatility, short U.S. Dollar, short equities, and short Bitcoin $BTC before the U.S.-China trade agreement was announced... Source: Barchart, Bloomberg
The S&P500 is flat on the year and less than 5% away from new all-time highs.
Congrats to those who stuck with their plan. Source: Ryan Detrick, CMT
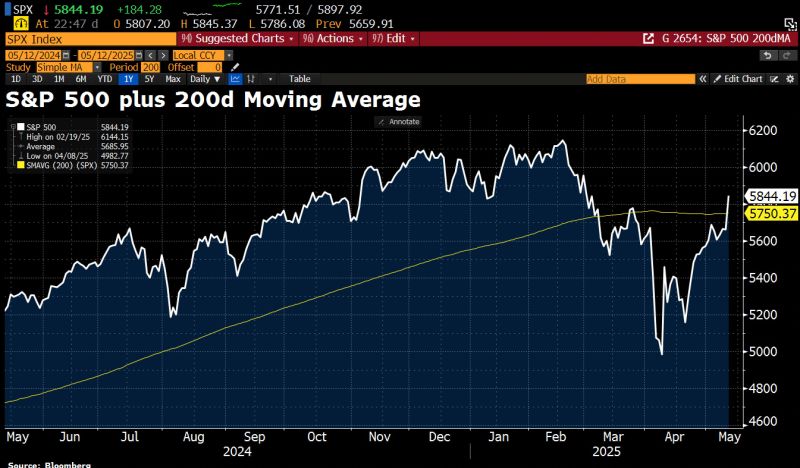
The S&P 500 just sprinted through 200-day moving average as Wall Street cheers the rollback of tariffs.
Skeptical strategists saw that level as a potential ceiling on the market rebound Source. Bloomberg, HolgerZ
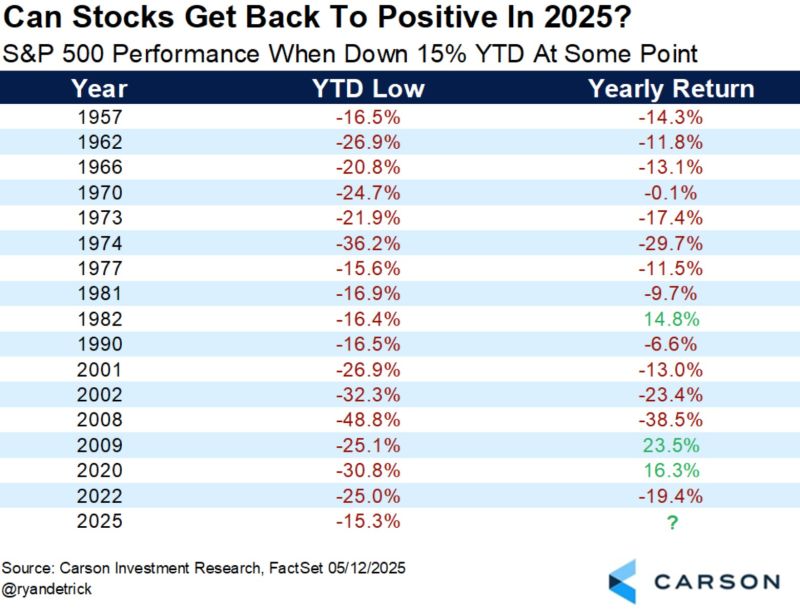
Only three times in history has the S&P 500 been down at least 15% YTD and moved back to positive by the end of the year.
Could this year will be number four? Source: Ryan Detrick