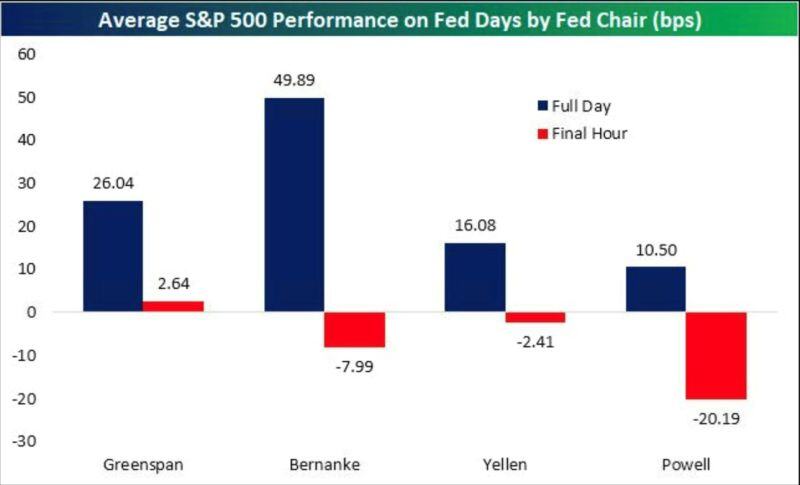
Powell is second to none when it comes to market reaction on Fed day.
He lived up to his reputation and track record yesterday. To say the least... Source: Bespoke
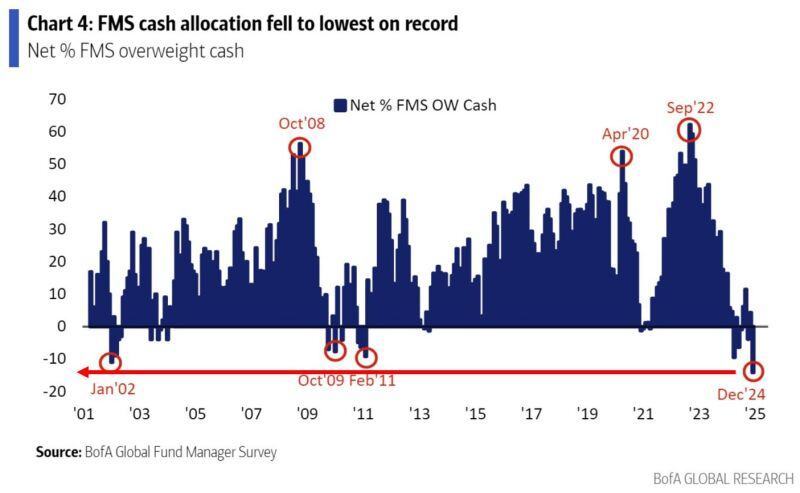
‼️AHEAD OF THE FED MEETING YESTERDAY, INSTITUTIONAL INVESTORS WERE ALL-IN ON US STOCKS AND CASH ALLOCATION AT RECORD LOW ‼️
Institutional investors* cash allocation hit the lowest level ON RECORD. This comes as allocation to US equities hit a RECORD HIGH. What will happen when stocks begin to drop? *171 Fund Managers with $450 billion in assets Source: BofA, Global Markets Investor
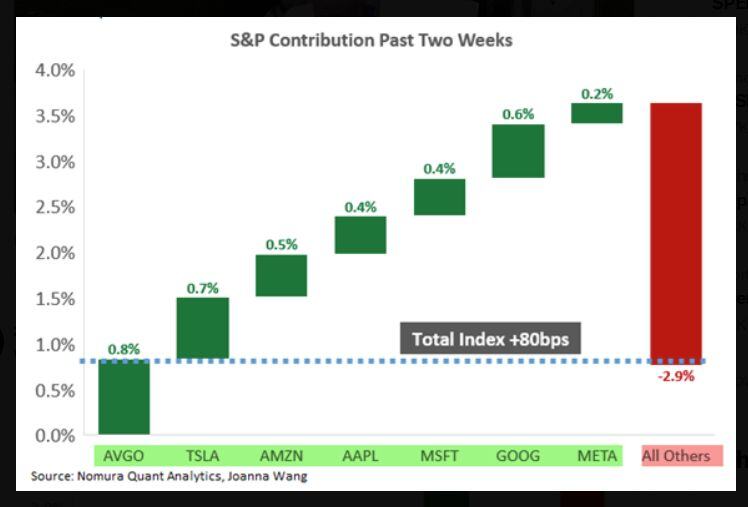
Why the S&P is up past two weeks
Source: Nomura thru zerohedge
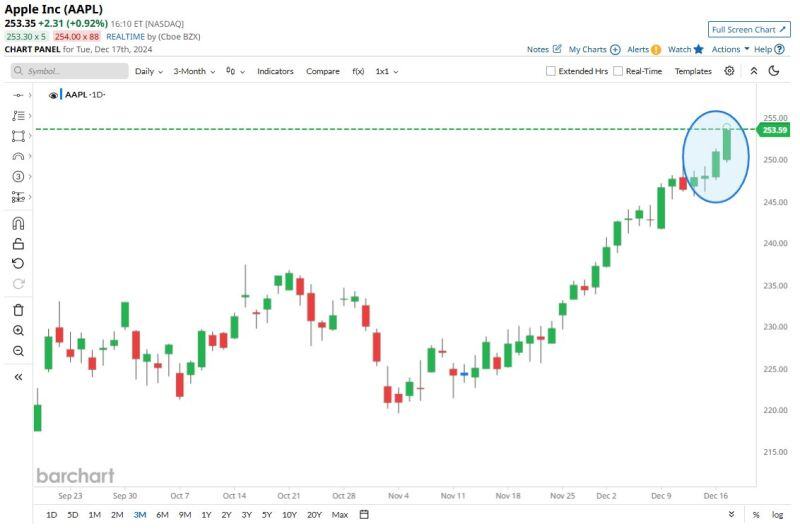
Apple = Unstoppable 📈 $AAPL has now made a new all-time high in 11 of the last 13 trading days
Source: Barchart
The stat of the day >>>
Yes, the Fed has already cut near all-time-highs and you know what ❓ The Bulls 🐮 Liked it 👍 The S&P 500 is less than 2% away from all-time highs the day before a Fed decision. Since 1980, there were 20 other times they cut rates within 2% of ATHs. The S&P 500 was higher a year later 20 times 🚀 Source: Ryan Detrick, CMT @RyanDetrick

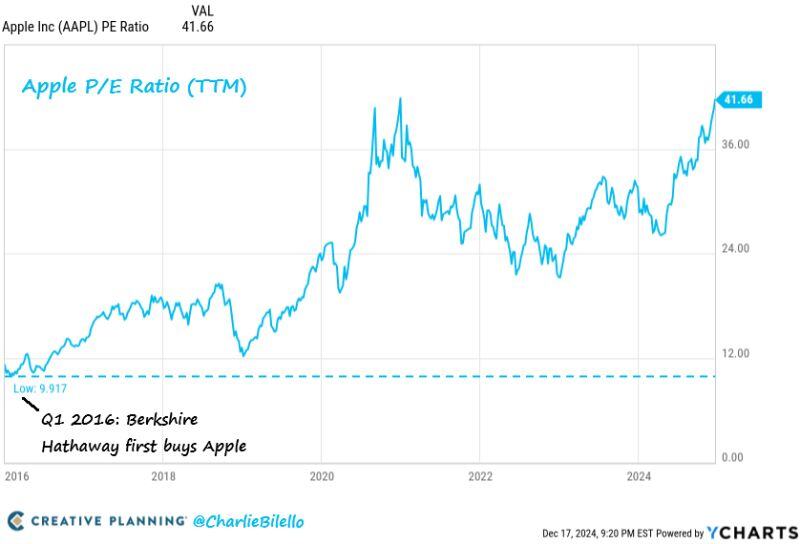
Apple now trades at over 41x earnings, its highest P/E ratio since 2007 (first iPhone was released).
When Berkshire Hathaway started buying Apple in 2016 it was trading at less than 10x earnings. Berkshire sold 67% of their stake this year. $AAPL Source: Charlie Bilello
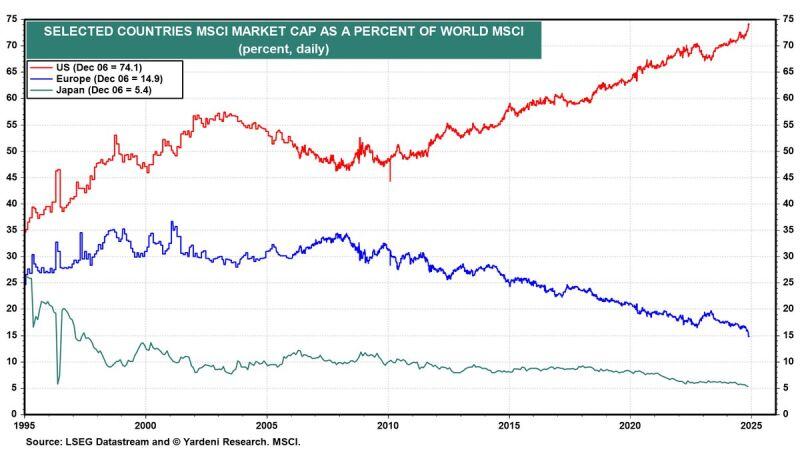
"The MSCI US now accounts for a staggering 74% of the market capitalization of the All Country World MSCI."
Source: Yardeni
BREAKING >>> The Dow Jones just hit an 8-day losing streak
The longest since 2018 $DIA