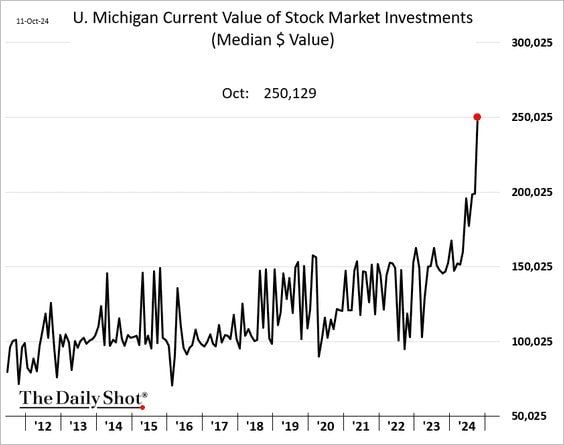
😱 The shocking chart of the day >>> The median value of US households’ stock portfolios has surged to $250k this month... 😱
This is twice as much as in early 2023... Middle to high income households enjoy a very strong "wealth effect" as both real estate and stock prices hit all time highs... Source: Stocktwits
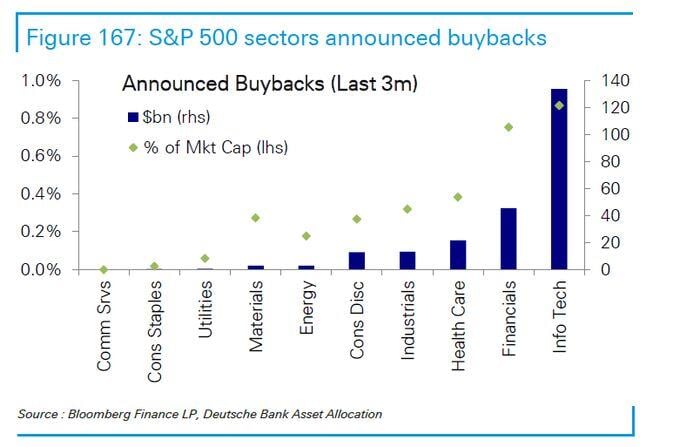
Who is buying back their stock?
Source. DB, Bloomberg
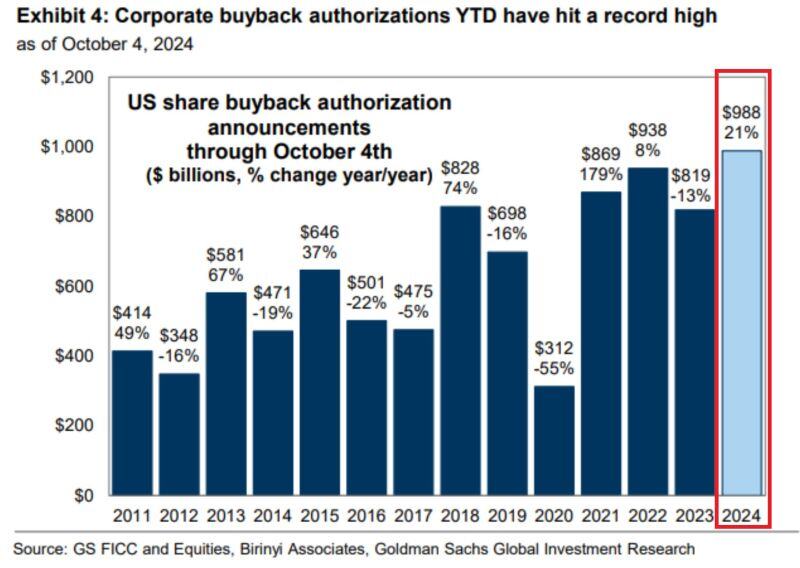
WONDERING WHY US STOCKS HAVE BEEN RALLIED SO HARD THIS YEAR
Part of the reasons is share buybacks which currently stand at all-time highs. As shown on the chart below, US share repurchase authorization announcements hit $988 billion, the most on record. This is 3 TIMES HIGHER THAN in 2020 and up 21% year-over-year. Source: Global Markets Investor, Goldman Sachs
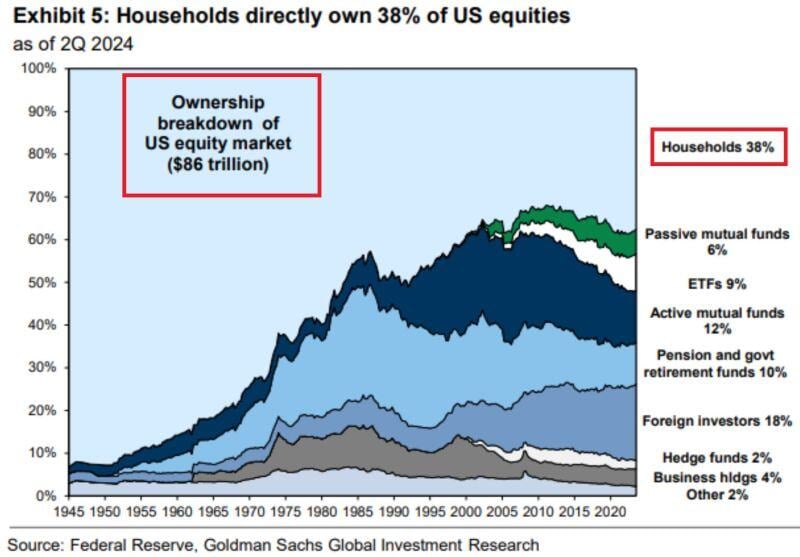
⁉️WHO OWNS THE MOST SHARE OF THE US STOCK MARKET⁉️
US households own 38% of the total equity market, the most among other participants. This equals to roughly $33 trillion. This is followed by foreign investors and active mutual funds with 18% and 12% shares respectively. Source: The Kobeissi Letter
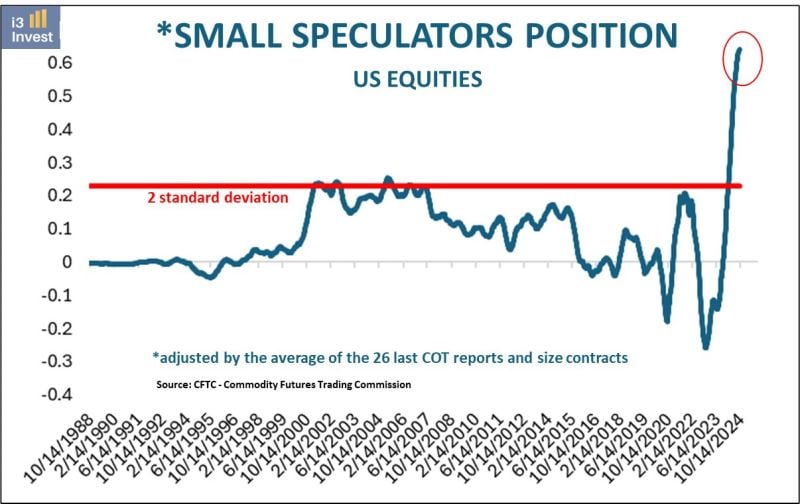
Small traders are extremely long in US equities.
Source: Guilherme Tavares i3 invest on X
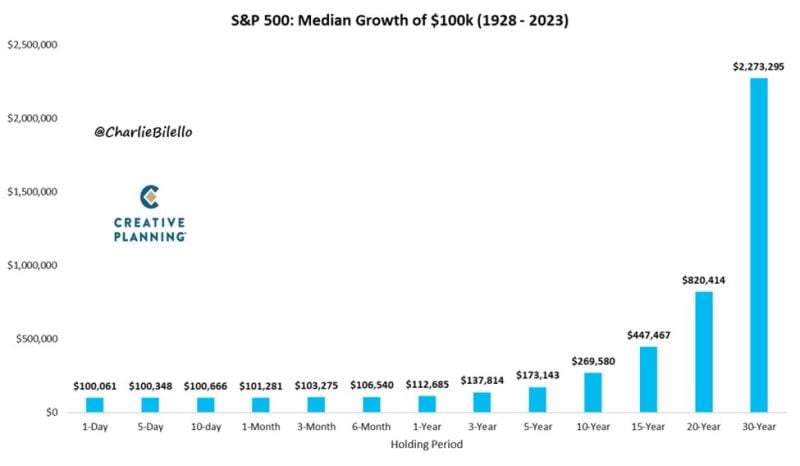
Time in the market vs. timing the market...
Time in the market can work magic! This is an example showing the median growth of 100k given length of time in the market. Source: Peter Mallouk, Charlie Bilello
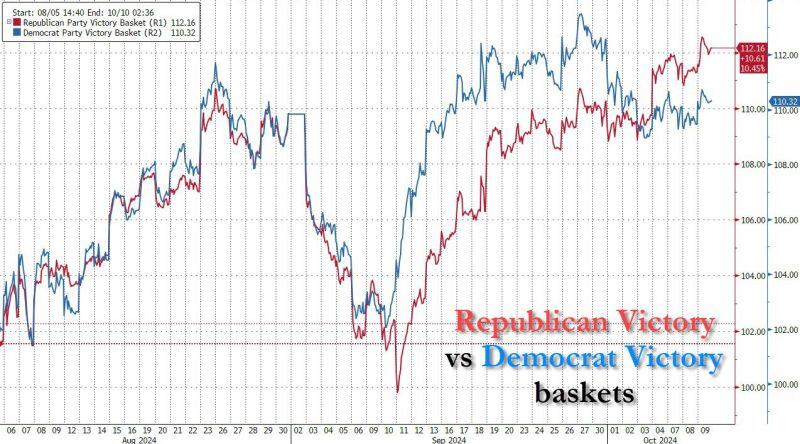
It's not just online betting markets:
Goldman's "Republican Victory" basket surged today and has taken the lead over "Democrat Victory" for the first time since the debate. Source: Bloomberg, www.zerohedge.com
Is this market unbreakable?
The S&P 500 is about to hit $50 TRILLION in market cap for the first time in history. It's now up +22% this year and over +40% since the October 2023 low. Despite many headwinds (Middle east tensions, US elections uncertainties, etc.), even a pullback of 5% is barely able to hold... How far can this bull market go without any correction??? Source: The Kobeissi Letter