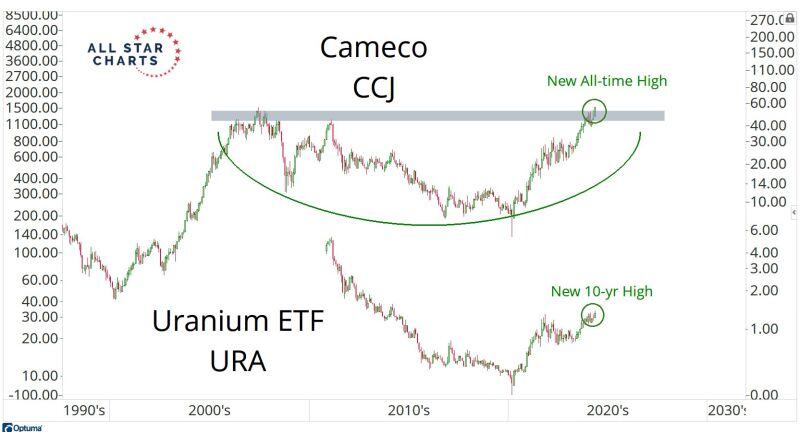
Interesting technical development for the uranium mining stocks with the $URA ETF trading at a 10-year high while sector leader Cameco $CCJ is trading at a new all-time-high.
Source: J-C Parets
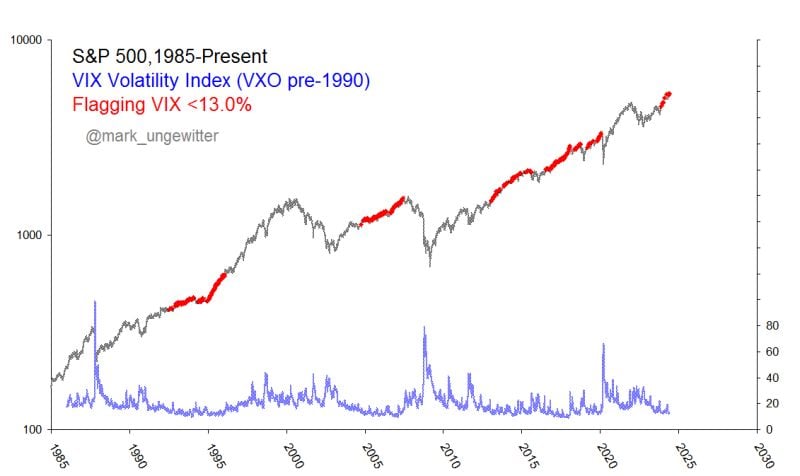
Low-volatility regimes can last longer than you think.
Source: Mark Ungewitter
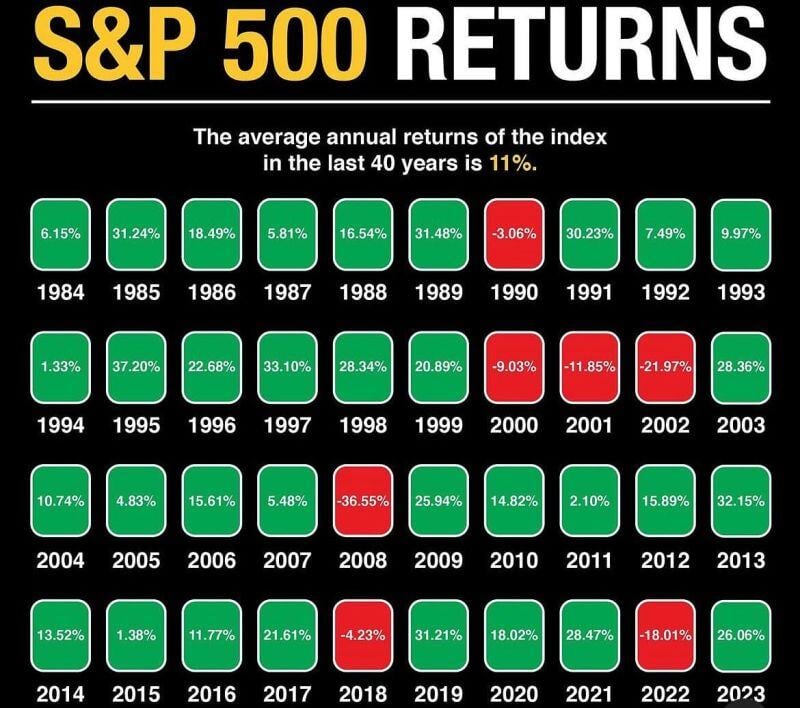
This is why you keep buying.
Source: Dividendology
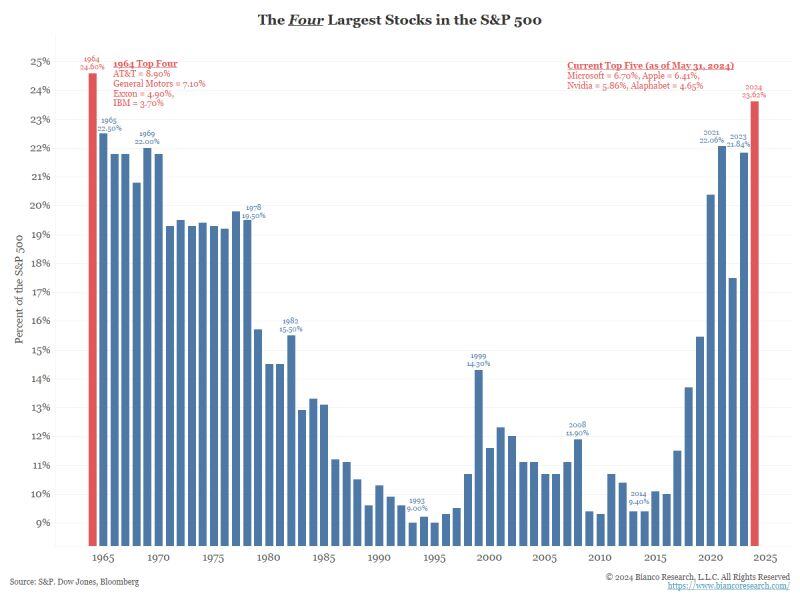
The $SPX is the most concentrated since 1964.
Restated, it has been 60 years since four stocks have accounted for this big a share of the $SPX. Source: Jim Bianco
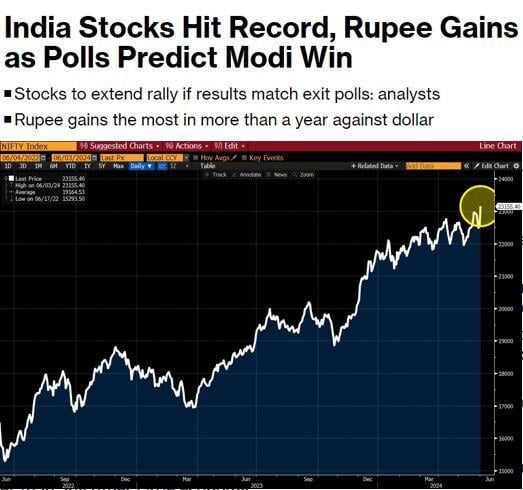
Exit polls show a clear victory for Prime Minister Modi’s party BJP + allies (called NDA = National Democratic Alliance).
The market is likely to view this very favorably, expecting another 5 years of policy stability, reforms and visibility on growth. Source: Bloomberg, David Ingles
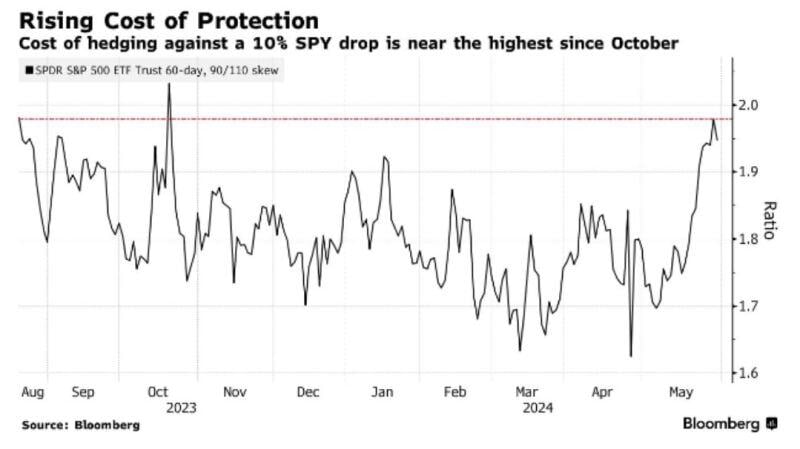
The cost to hedge a 10% drop in the S&P 500 reached its highest level since October
Source: Win Smart, Bloomberg
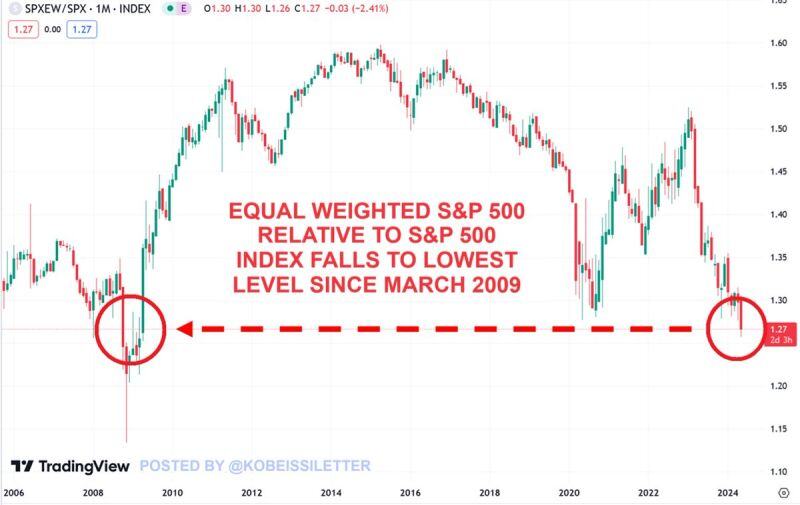
The equal-weighted SP500 relative to the S&P 500 index has dropped to its lowest level since March 2009.
This year, the S&P 500 has gained ~10% while the equal-weighted index rallied just 3%. At the same time, Magnificent 7 stocks have rallied over 50%. Since the ratio peaked in February 2023, the S&P 500 is up ~29% compared to a 7% gain of the equal-weighted index. Meanwhile, the top 10% of US stocks now account for ~75% of the S&P 500, the most since the 1930s’. The market has never been driven by so few names. Source: The Kobeissi Letter
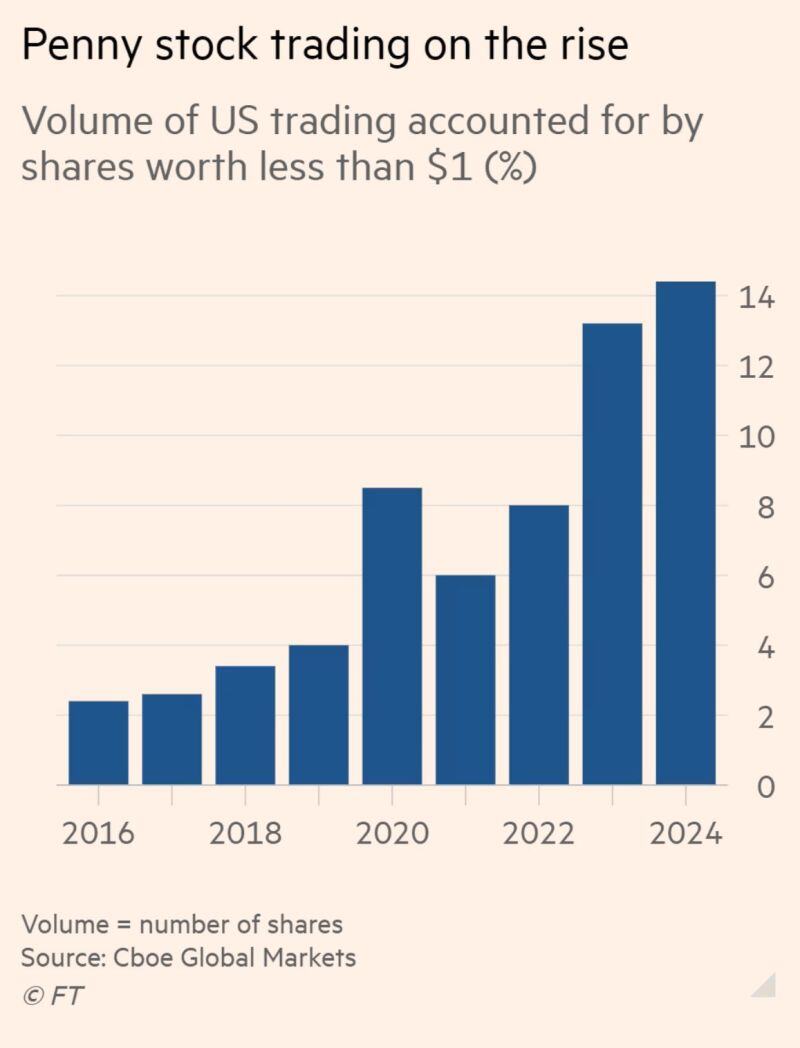
Penny stock trading is booming.
Seven of the top 10 most traded US equities in May are penny stocks worth less than $1. None are profitable Source: FT, Gunjan Banerji